WHO European Region · 53 countries · Multi-country case study
What could Europe gain from doubling cycling?
What could happen if countries worked together to double cycling across the WHO European Region? This case study uses WHO’s Health Economic Assessment Tool (HEAT) to illustrate the health, climate and monetary benefits of that change across 53 countries.
The scenario
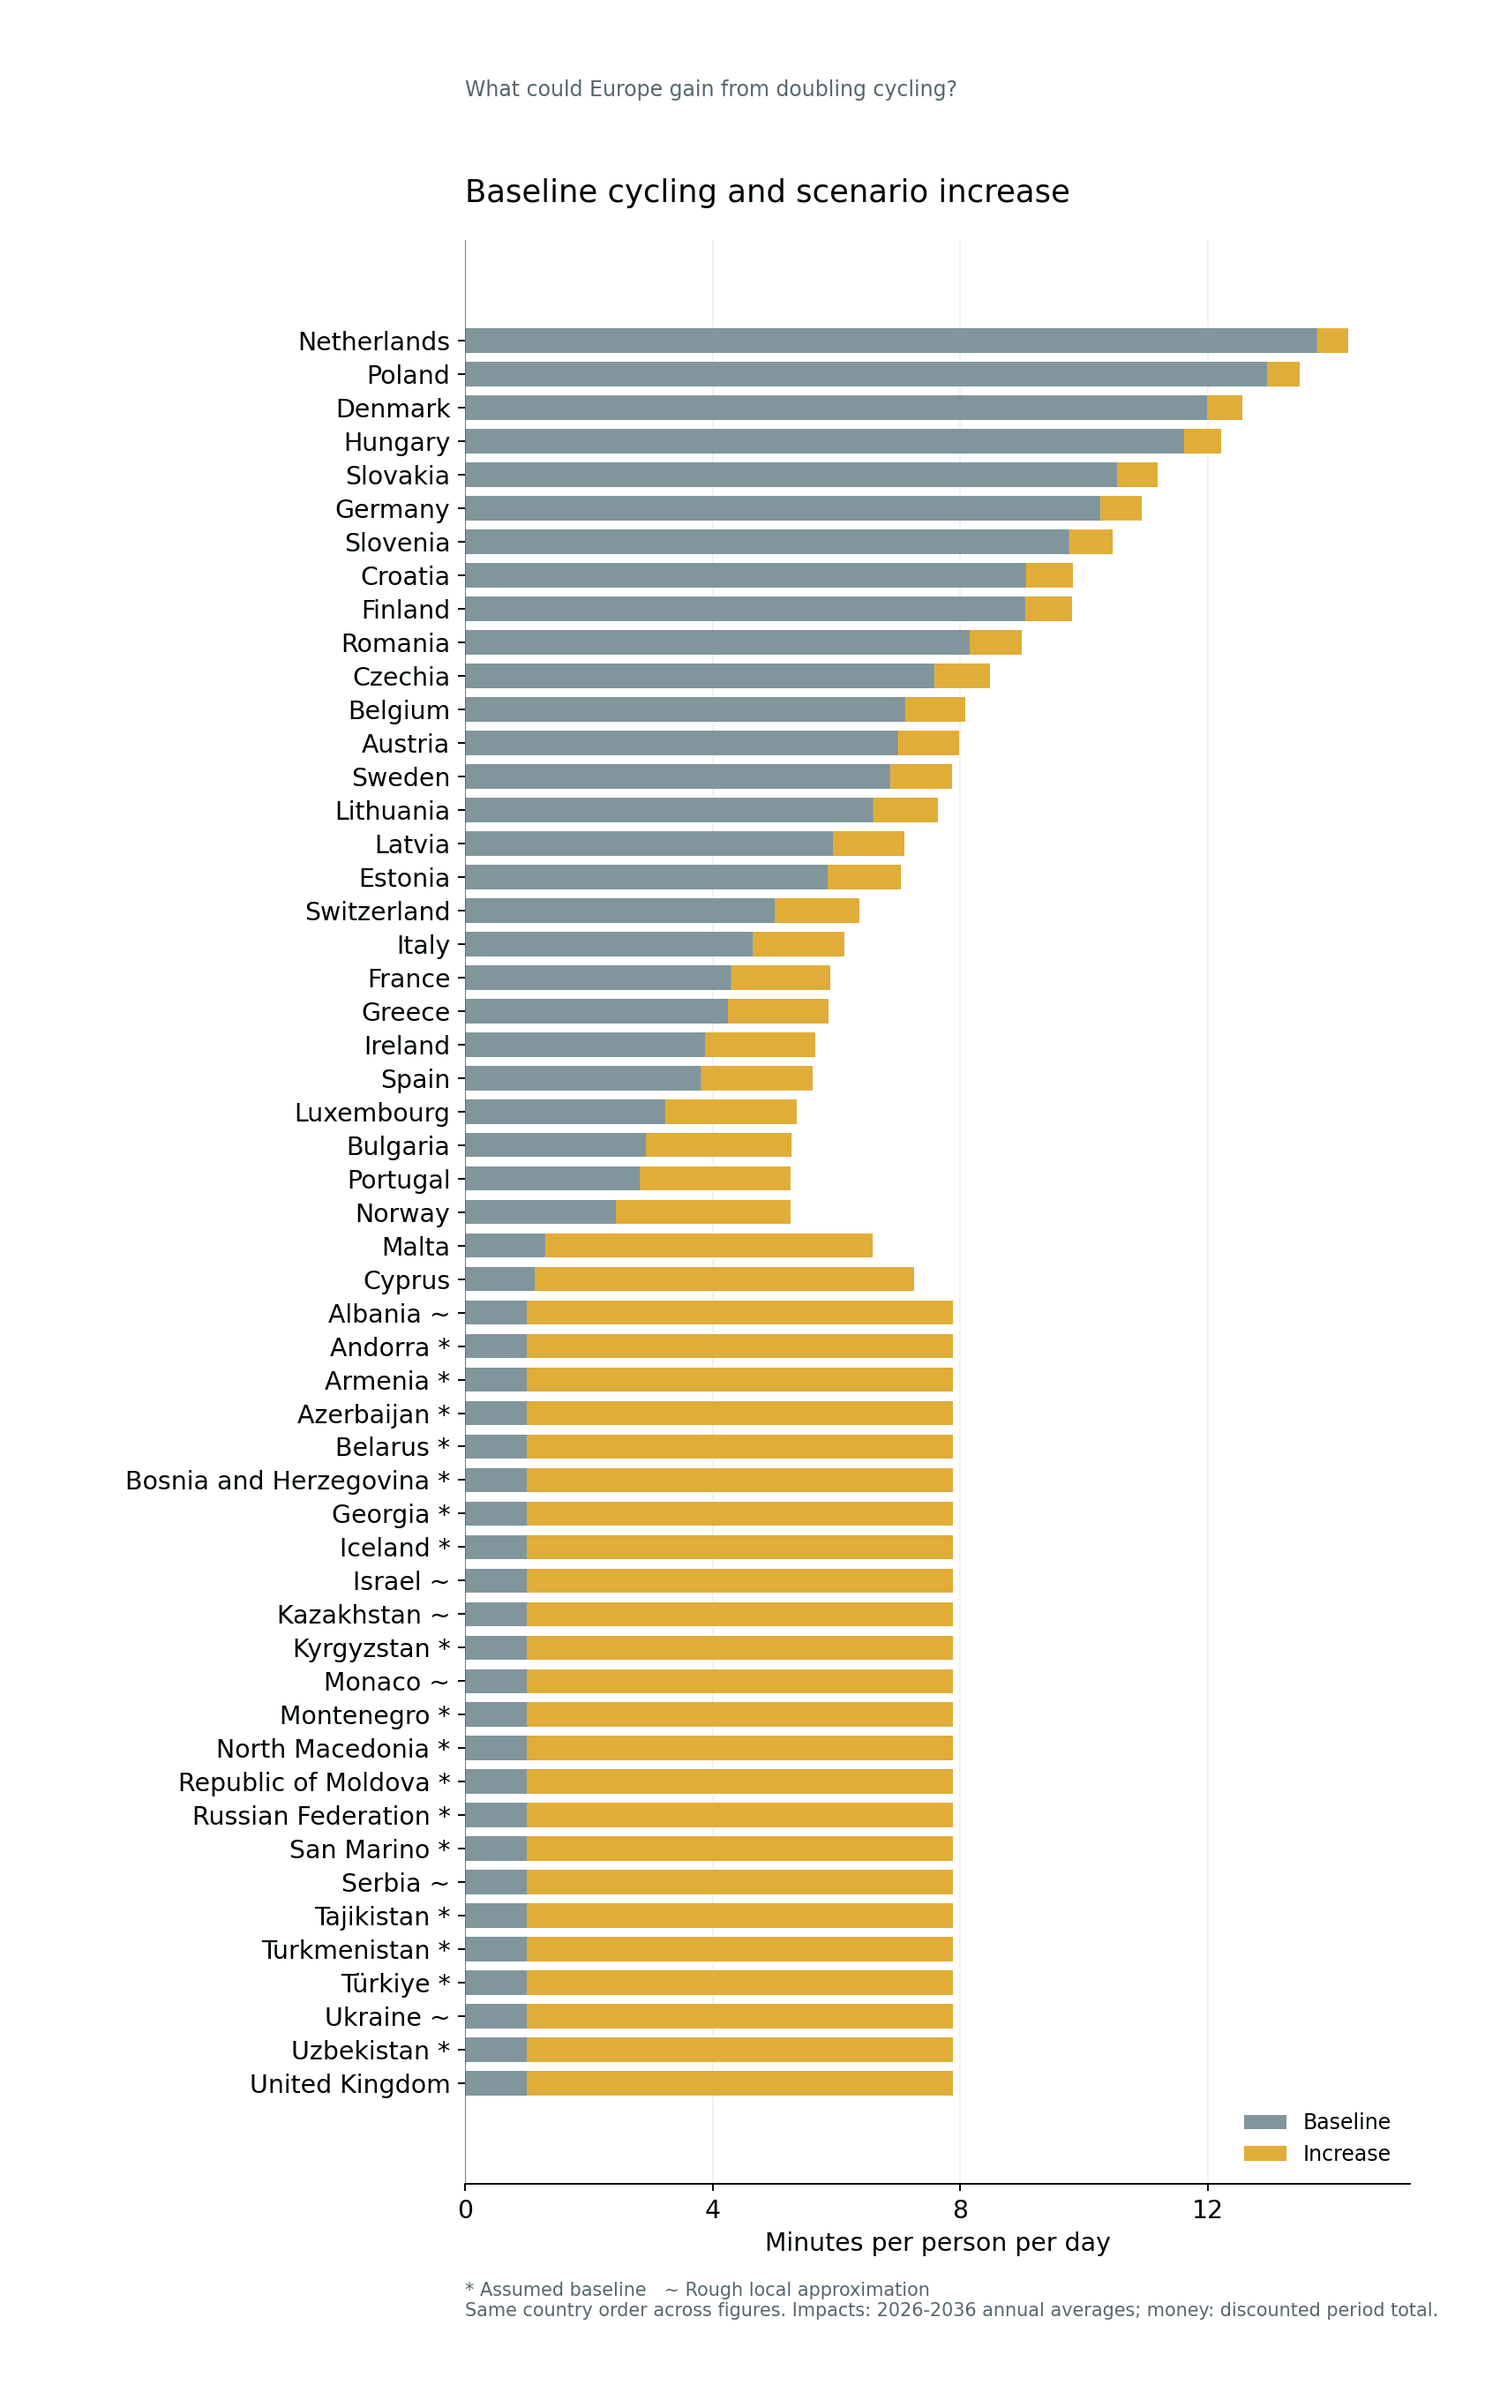
The population-weighted regional average doubles from 4.1 to 8.2 minutes of cycling per person per day. Every country increases, with larger increases where baseline cycling is lower. The target level is reached in 2030.
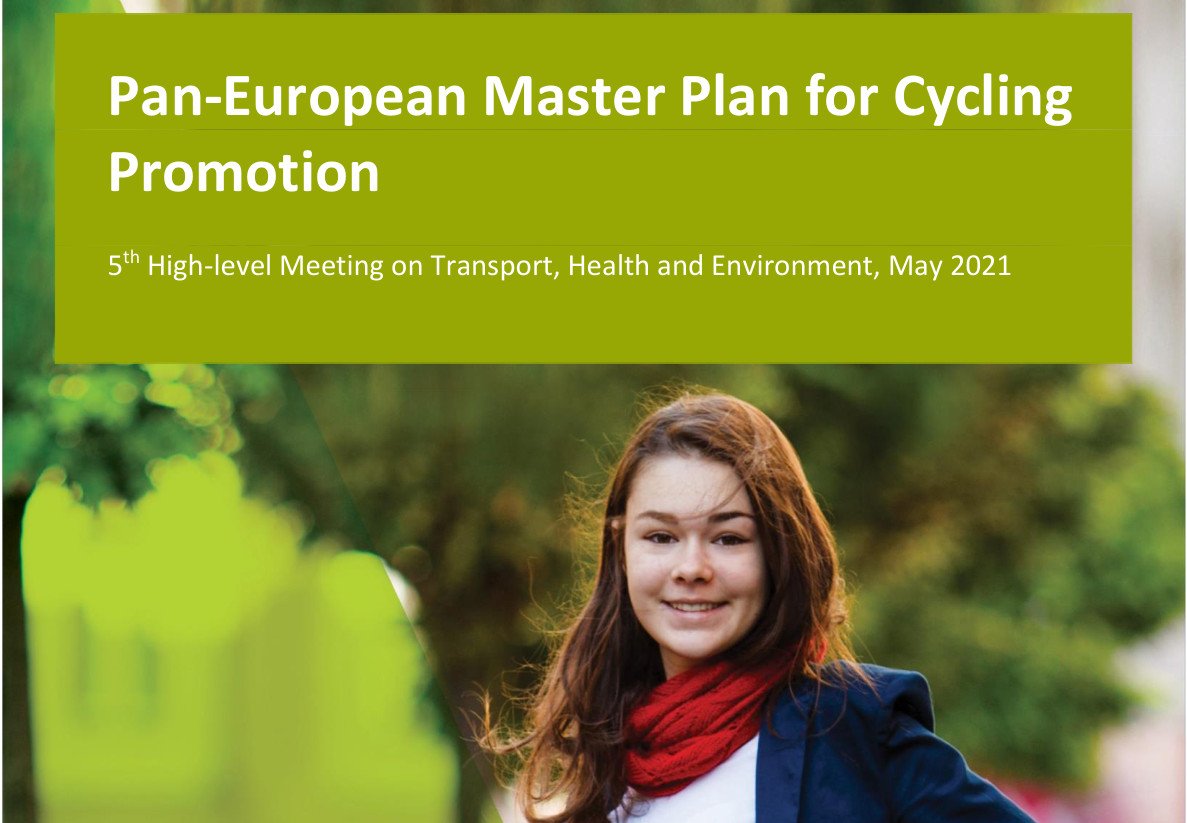
Read the Pan-European Master Plan for Cycling Promotion (2021), paragraph 31(a).
The results
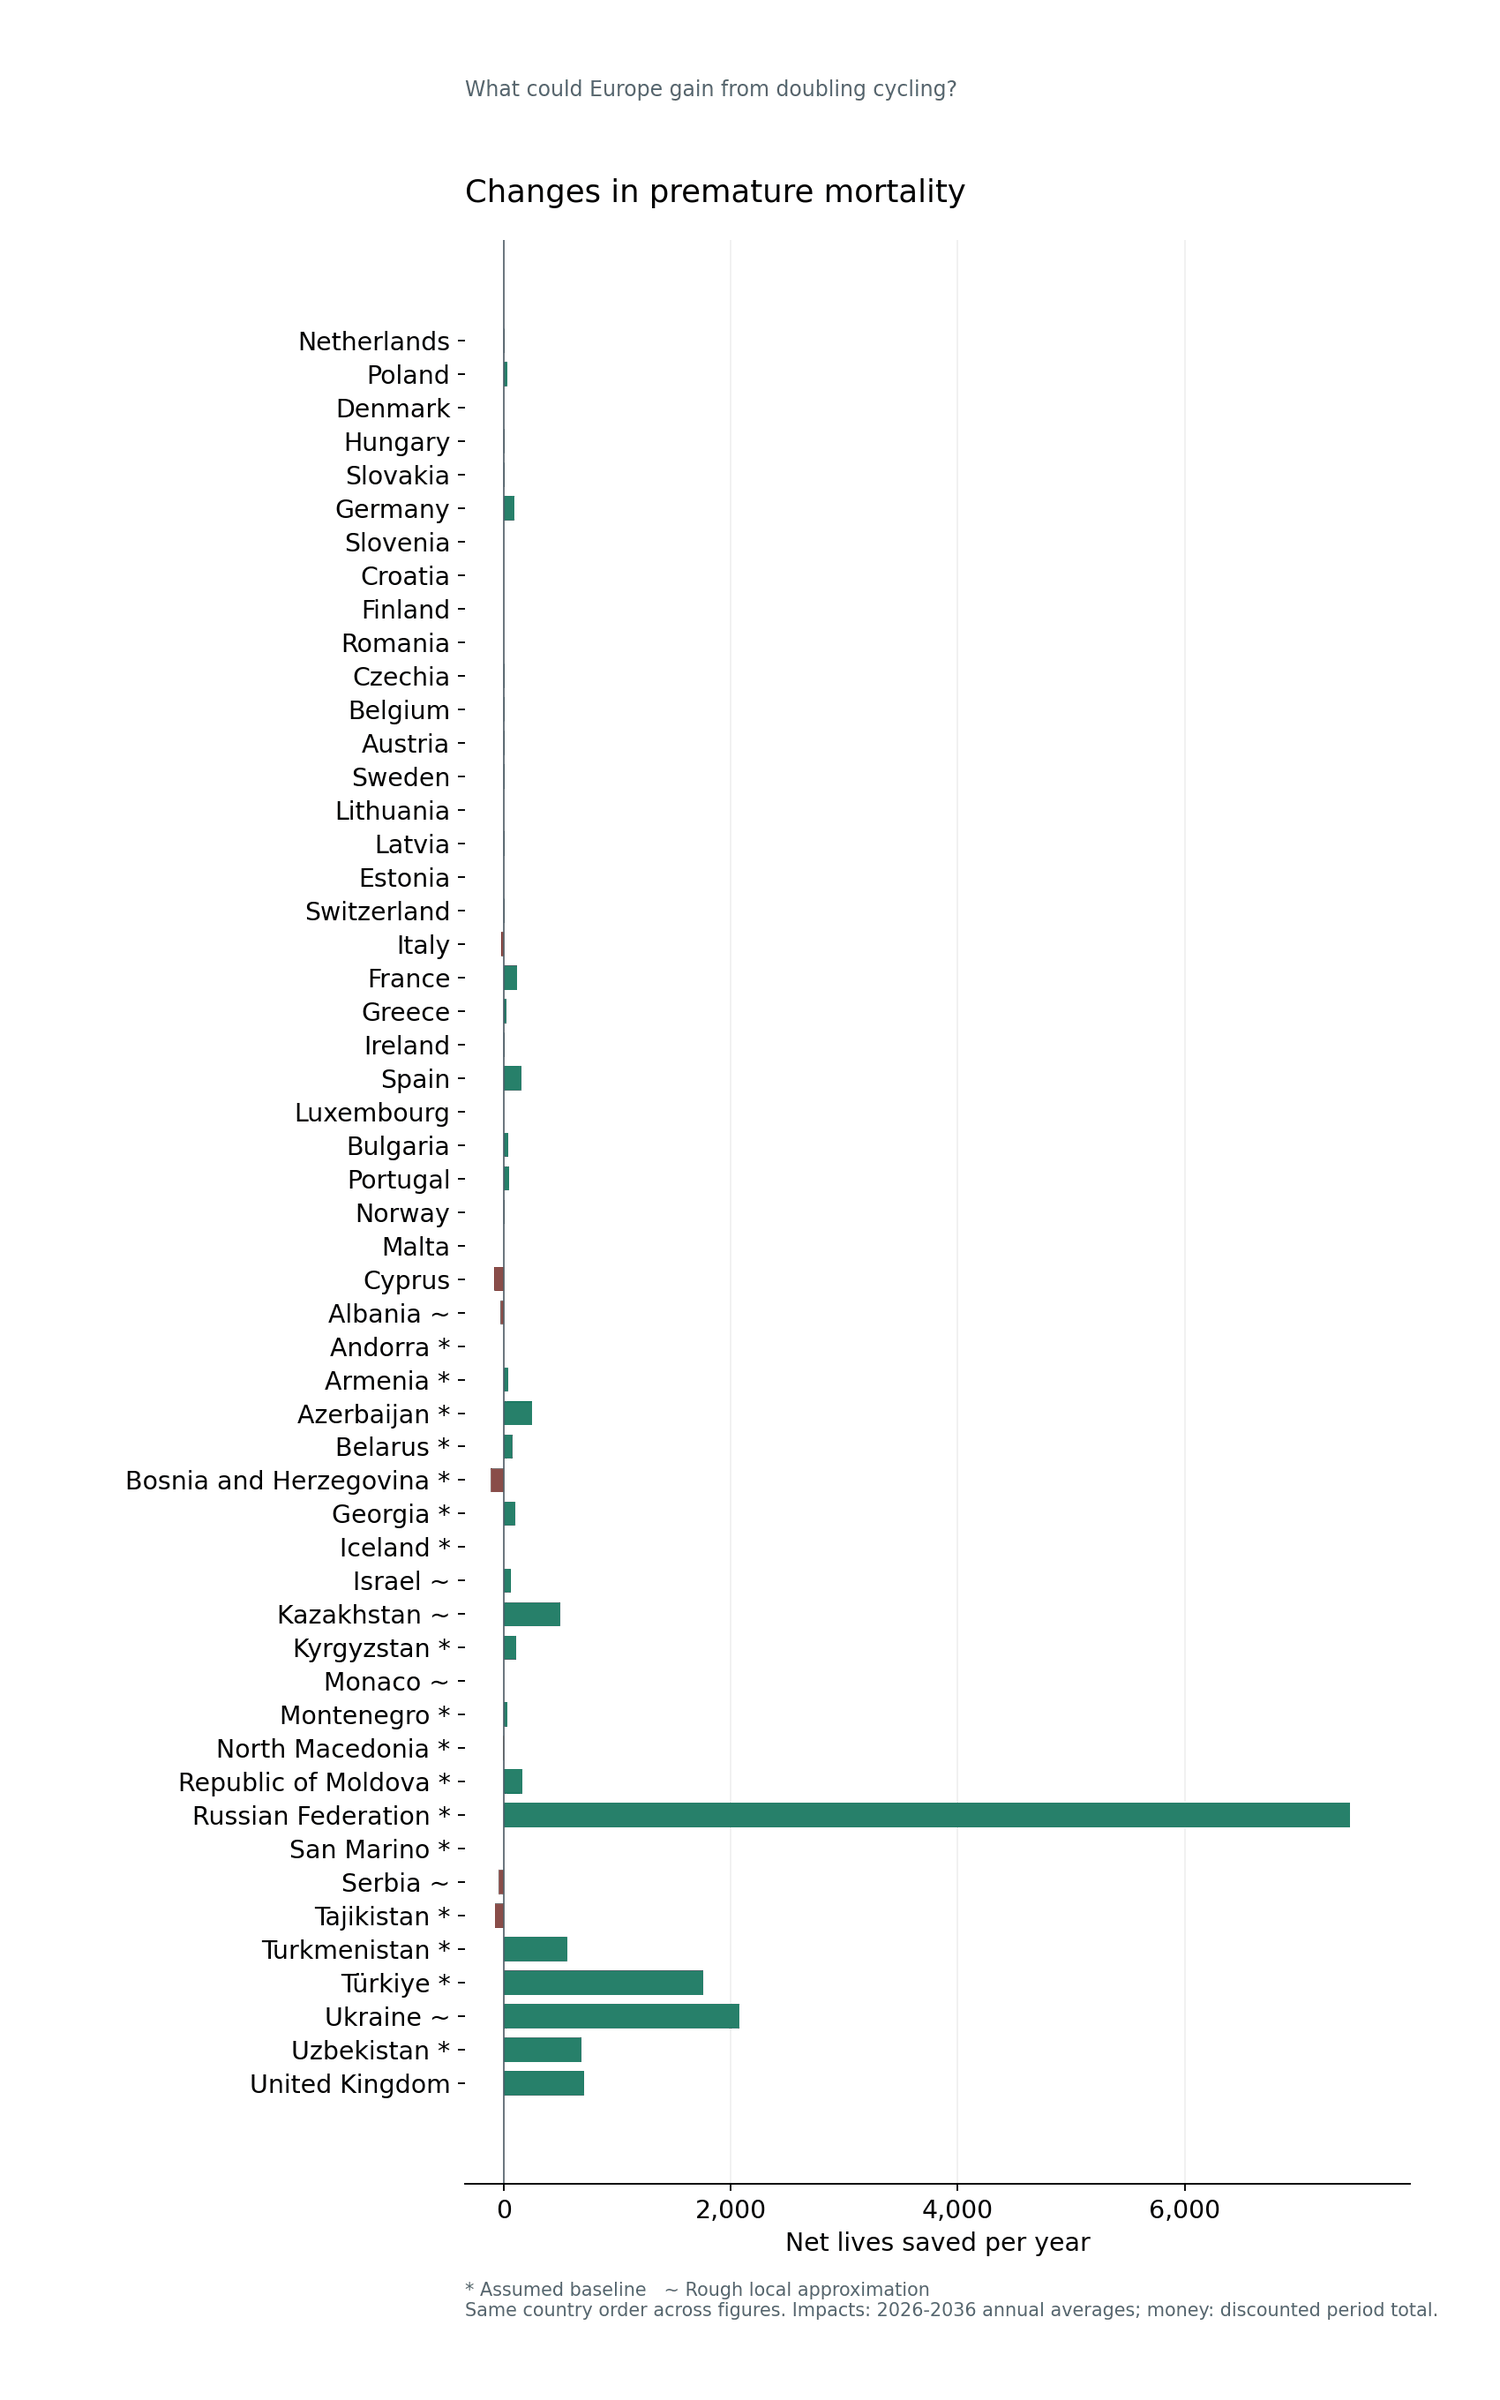
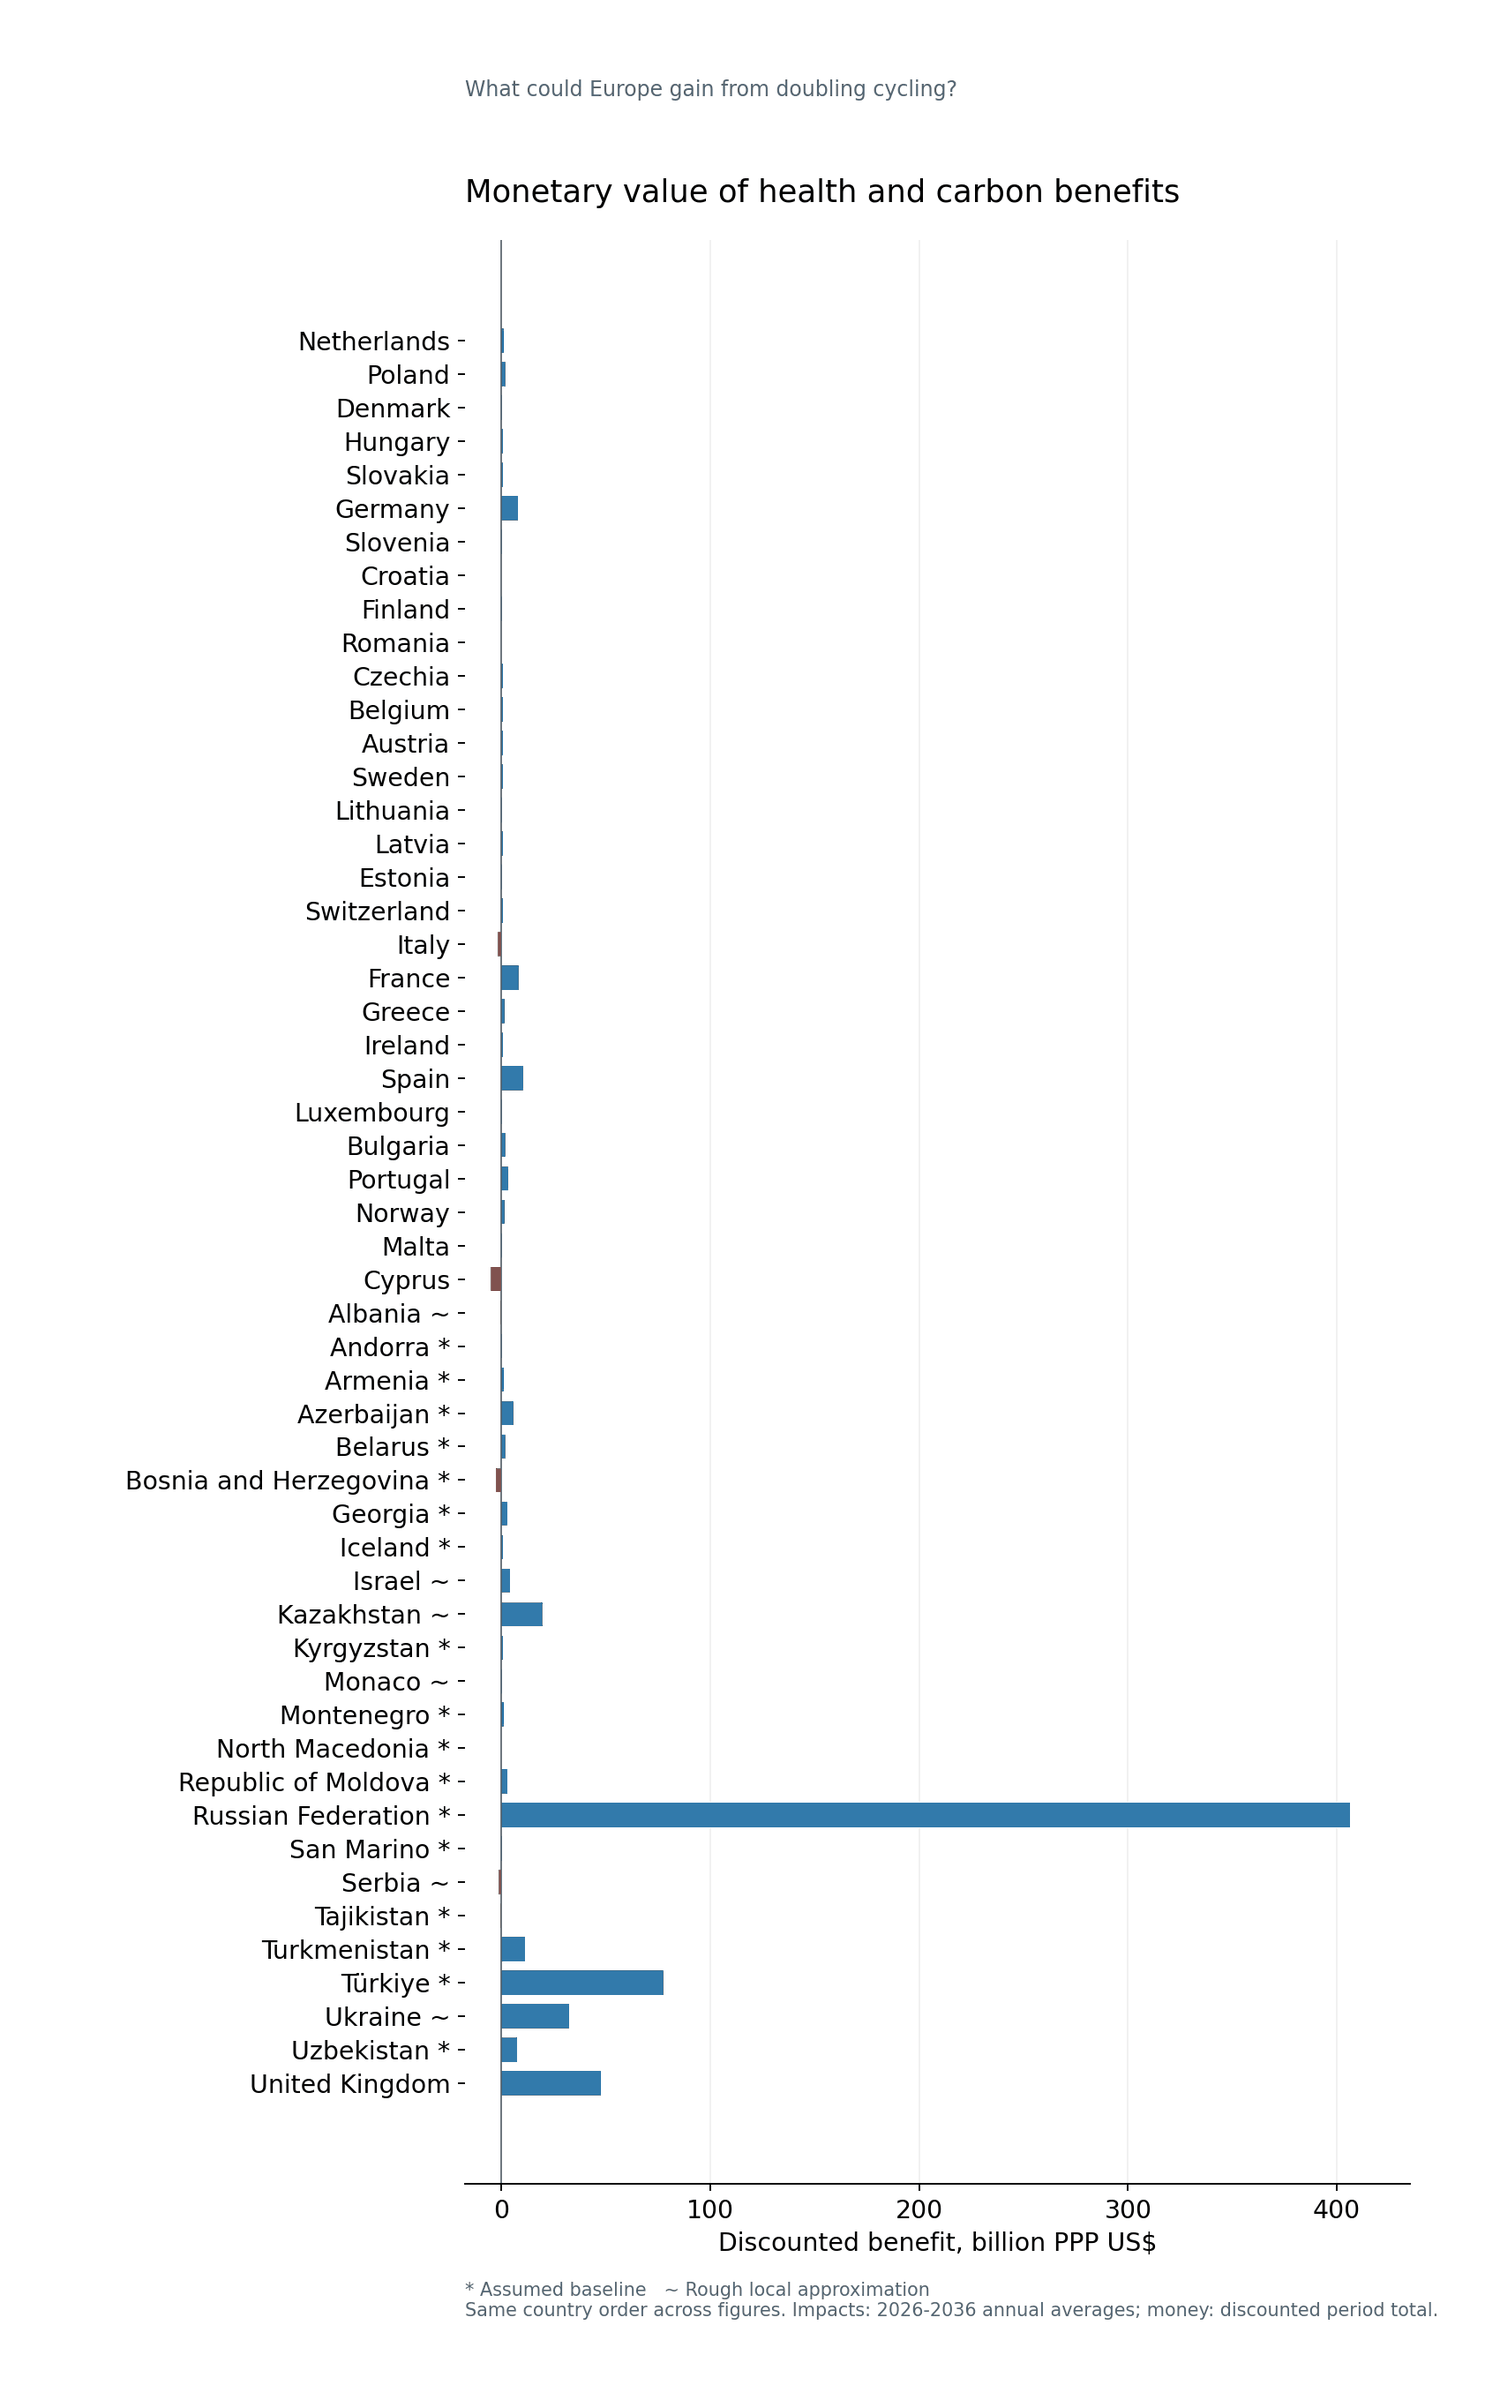
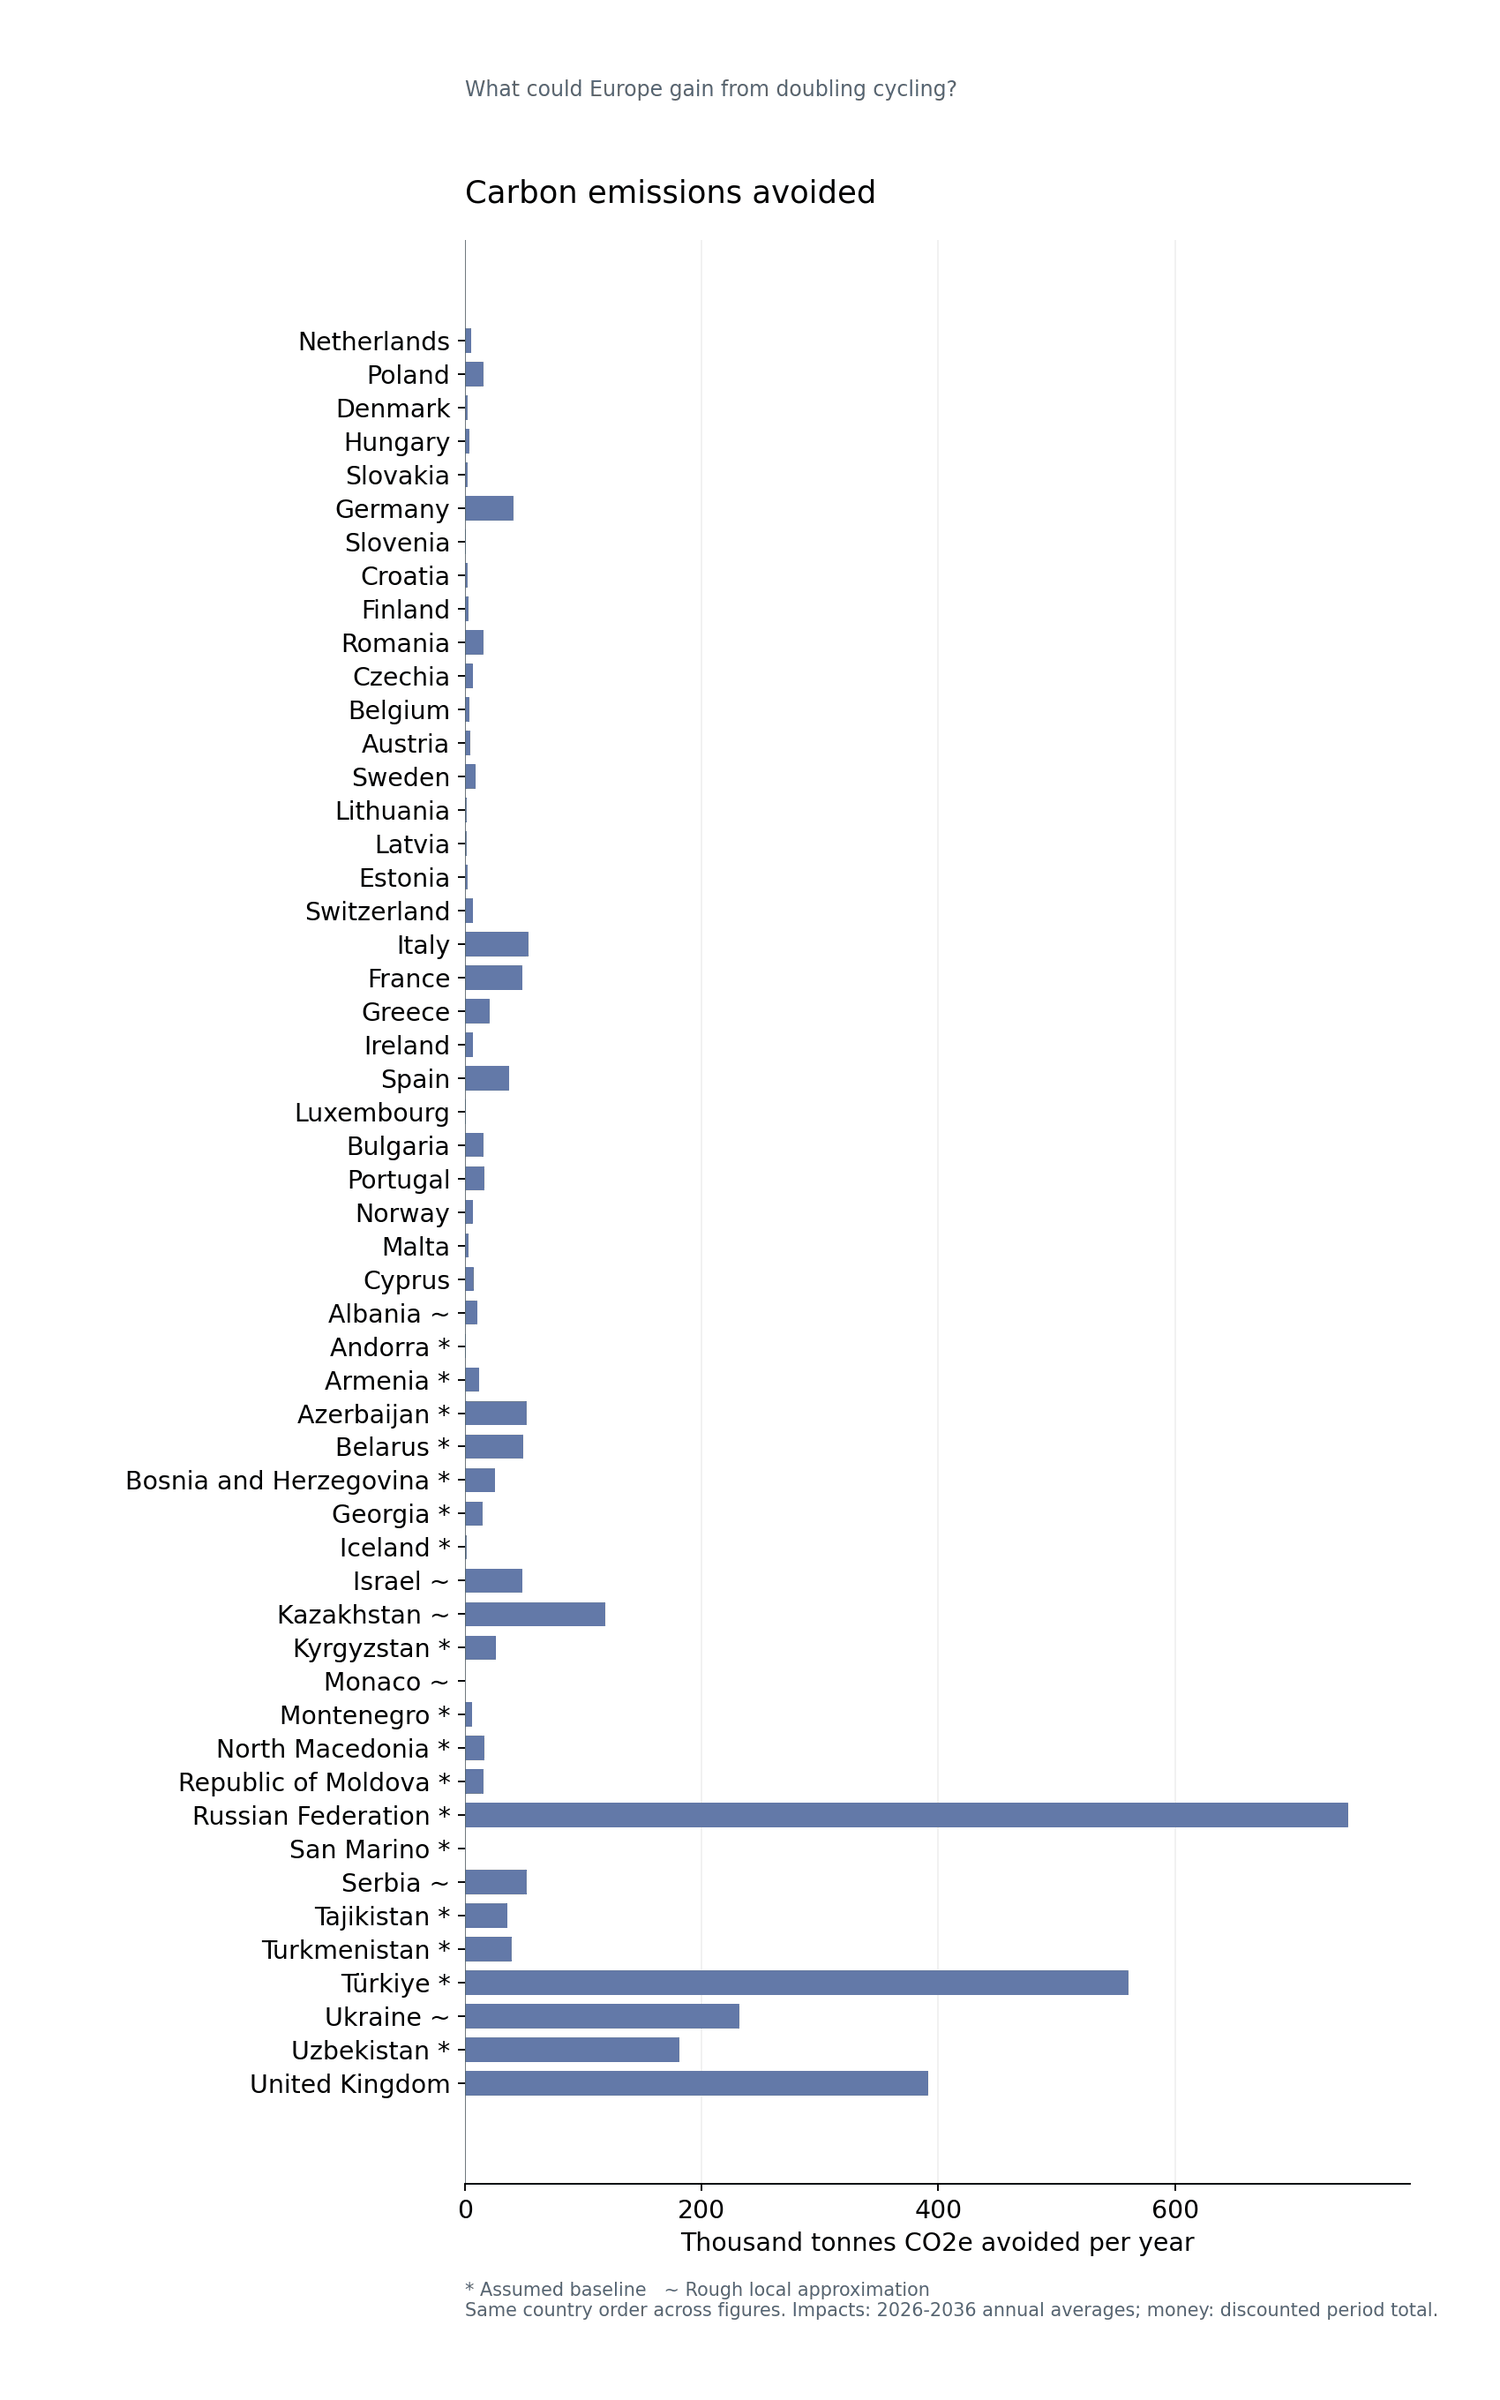
Across all 53 countries, HEAT estimates around 15,000 net lives saved per year, 3 million tonnes of CO2e avoided per year and US$650 billion in discounted monetary benefits (purchasing power parity). Lives saved and emissions avoided are annual averages over 2026-2036; monetary benefits cover the whole period.
Monetary benefits value changes in premature mortality from physical activity, air-pollution exposure while travelling and fatal crashes, together with avoided carbon emissions. They are not cash or health-care expenditure savings. The costs of achieving the travel changes are not deducted.
Baseline and scenario by country
Net lives saved by country
Monetary benefits by country
Carbon emissions avoided by country
Where does the additional travel come from?
Added conventional cycling uses HEAT’s default substitution shares: 30% from car travel, 50% from public transport and 20% from walking. The reduced walking enters the net health estimate. Switzerland retains a separate e-bike component, with HEAT’s mode-specific defaults. A reduction cannot exceed the adopted baseline of the displaced mode. If that limit is reached, the unavailable share is reassigned to car and public transport in their existing proportions. These substitution shares are assumptions, not measured national shifts.
Data sources used and treatment of missing data
Survey-based published or transformed estimates are available for 30 countries: the EU27, Norway, Switzerland and the United Kingdom. England supplies the UK travel estimate. Most EU inputs come from European Commission mobility tables; the other principal sources are the Swiss, Norwegian and English travel surveys. Published shares and distances are converted to daily minutes where necessary, retaining their original source years and documented assumptions.
For countries without an adopted cycling estimate, we assume a very low positive level of 1 minute per person per day. Available positive local approximations remain in use. These are scenario inputs, not measured national cycling levels. The evidence register distinguishes 30 survey-based/transformed estimates, 6 rough local approximations and 17 assumed baselines. The survey-based countries contribute about 1,300 of the annual net lives saved; this subtotal describes evidence coverage, not uncertainty bounds.
Country-specific population, mortality, air-pollution and economic inputs are used where available. Missing mortality rates for Andorra, Monaco and San Marino are approximated using Spain, France and Italy respectively; missing statistical-life values use France for Monaco and Italy for San Marino. This fills particular health/economic data gaps while retaining each country’s own population and any available national inputs. Germany supplies only missing crash rates, rather than replacing available national rates.
Countries with survey-based or transformed estimates
Austria, Belgium, Bulgaria, Croatia, Cyprus, Czechia, Denmark, Estonia, Finland, France, Germany, Greece, Hungary, Ireland, Italy, Latvia, Lithuania, Luxembourg, Malta, Netherlands, Norway, Poland, Portugal, Romania, Slovakia, Slovenia, Spain, Sweden, Switzerland, United Kingdom.
How was it calculated?
This case study was conducted using the HEAT API. One two-case assessment was configured in the web interface and exported. Country-specific baseline, scenario and background inputs were then supplied through code. The health assessment includes changes in physical activity, PM2.5 exposure while travelling and fatal road crashes, including changes in the displaced active mode. Carbon estimates use the mode-substitution assumptions for the added cycling; the linked loss of the other active mode is not counted as a second independent carbon intervention.
National PM2.5 inputs are WHO modelled population-weighted concentrations for 2023. This pathway assesses exposure while travelling; it does not model changes in ambient air pollution for the wider population.
How should the results be used?
This is a what-if illustration, not a forecast or a harmonised country ranking. Source years, age ranges and travel definitions differ; some inputs use city figures or other indirect evidence. Assumptions for populous countries with limited data can strongly influence regional totals. Crash-risk assumptions and HEAT’s model and valuation settings also affect the results. The walking and cycling scenarios should be read separately and not added together.
Sources and further information
- European Commission (2022). New Mobility Patterns in European Cities, Task A tables and annexes.
- BFS/ARE (2023). Mobility and Transport Microcensus 2021, table T3.3.1.1; residents aged 6+, domestic stages, all days and purposes.
- Norwegian National Travel Survey 2024, national key figures.
- UK Department for Transport. National Travel Survey 2024, active travel in England.
- WHO national population-weighted PM2.5 estimates, 2023, supplied via the UN SDG database.
- Pan-European Master Plan for Cycling Promotion (2021), paragraph 31(a), printed page 14.
Download the full case-study report (PDF) · HEAT API guidance