HEAT step-by-step guide
HEAT is applied through 5 main steps. Keep this guide beside the HEAT tool while entering your assessment.
Use Next and Back to move through the tool, or return to an earlier section using its left-hand menu. Do not use the back-button of your browser.
Only questions relevant to your chosen modes, impacts and use case appear; several items below may share one screen.
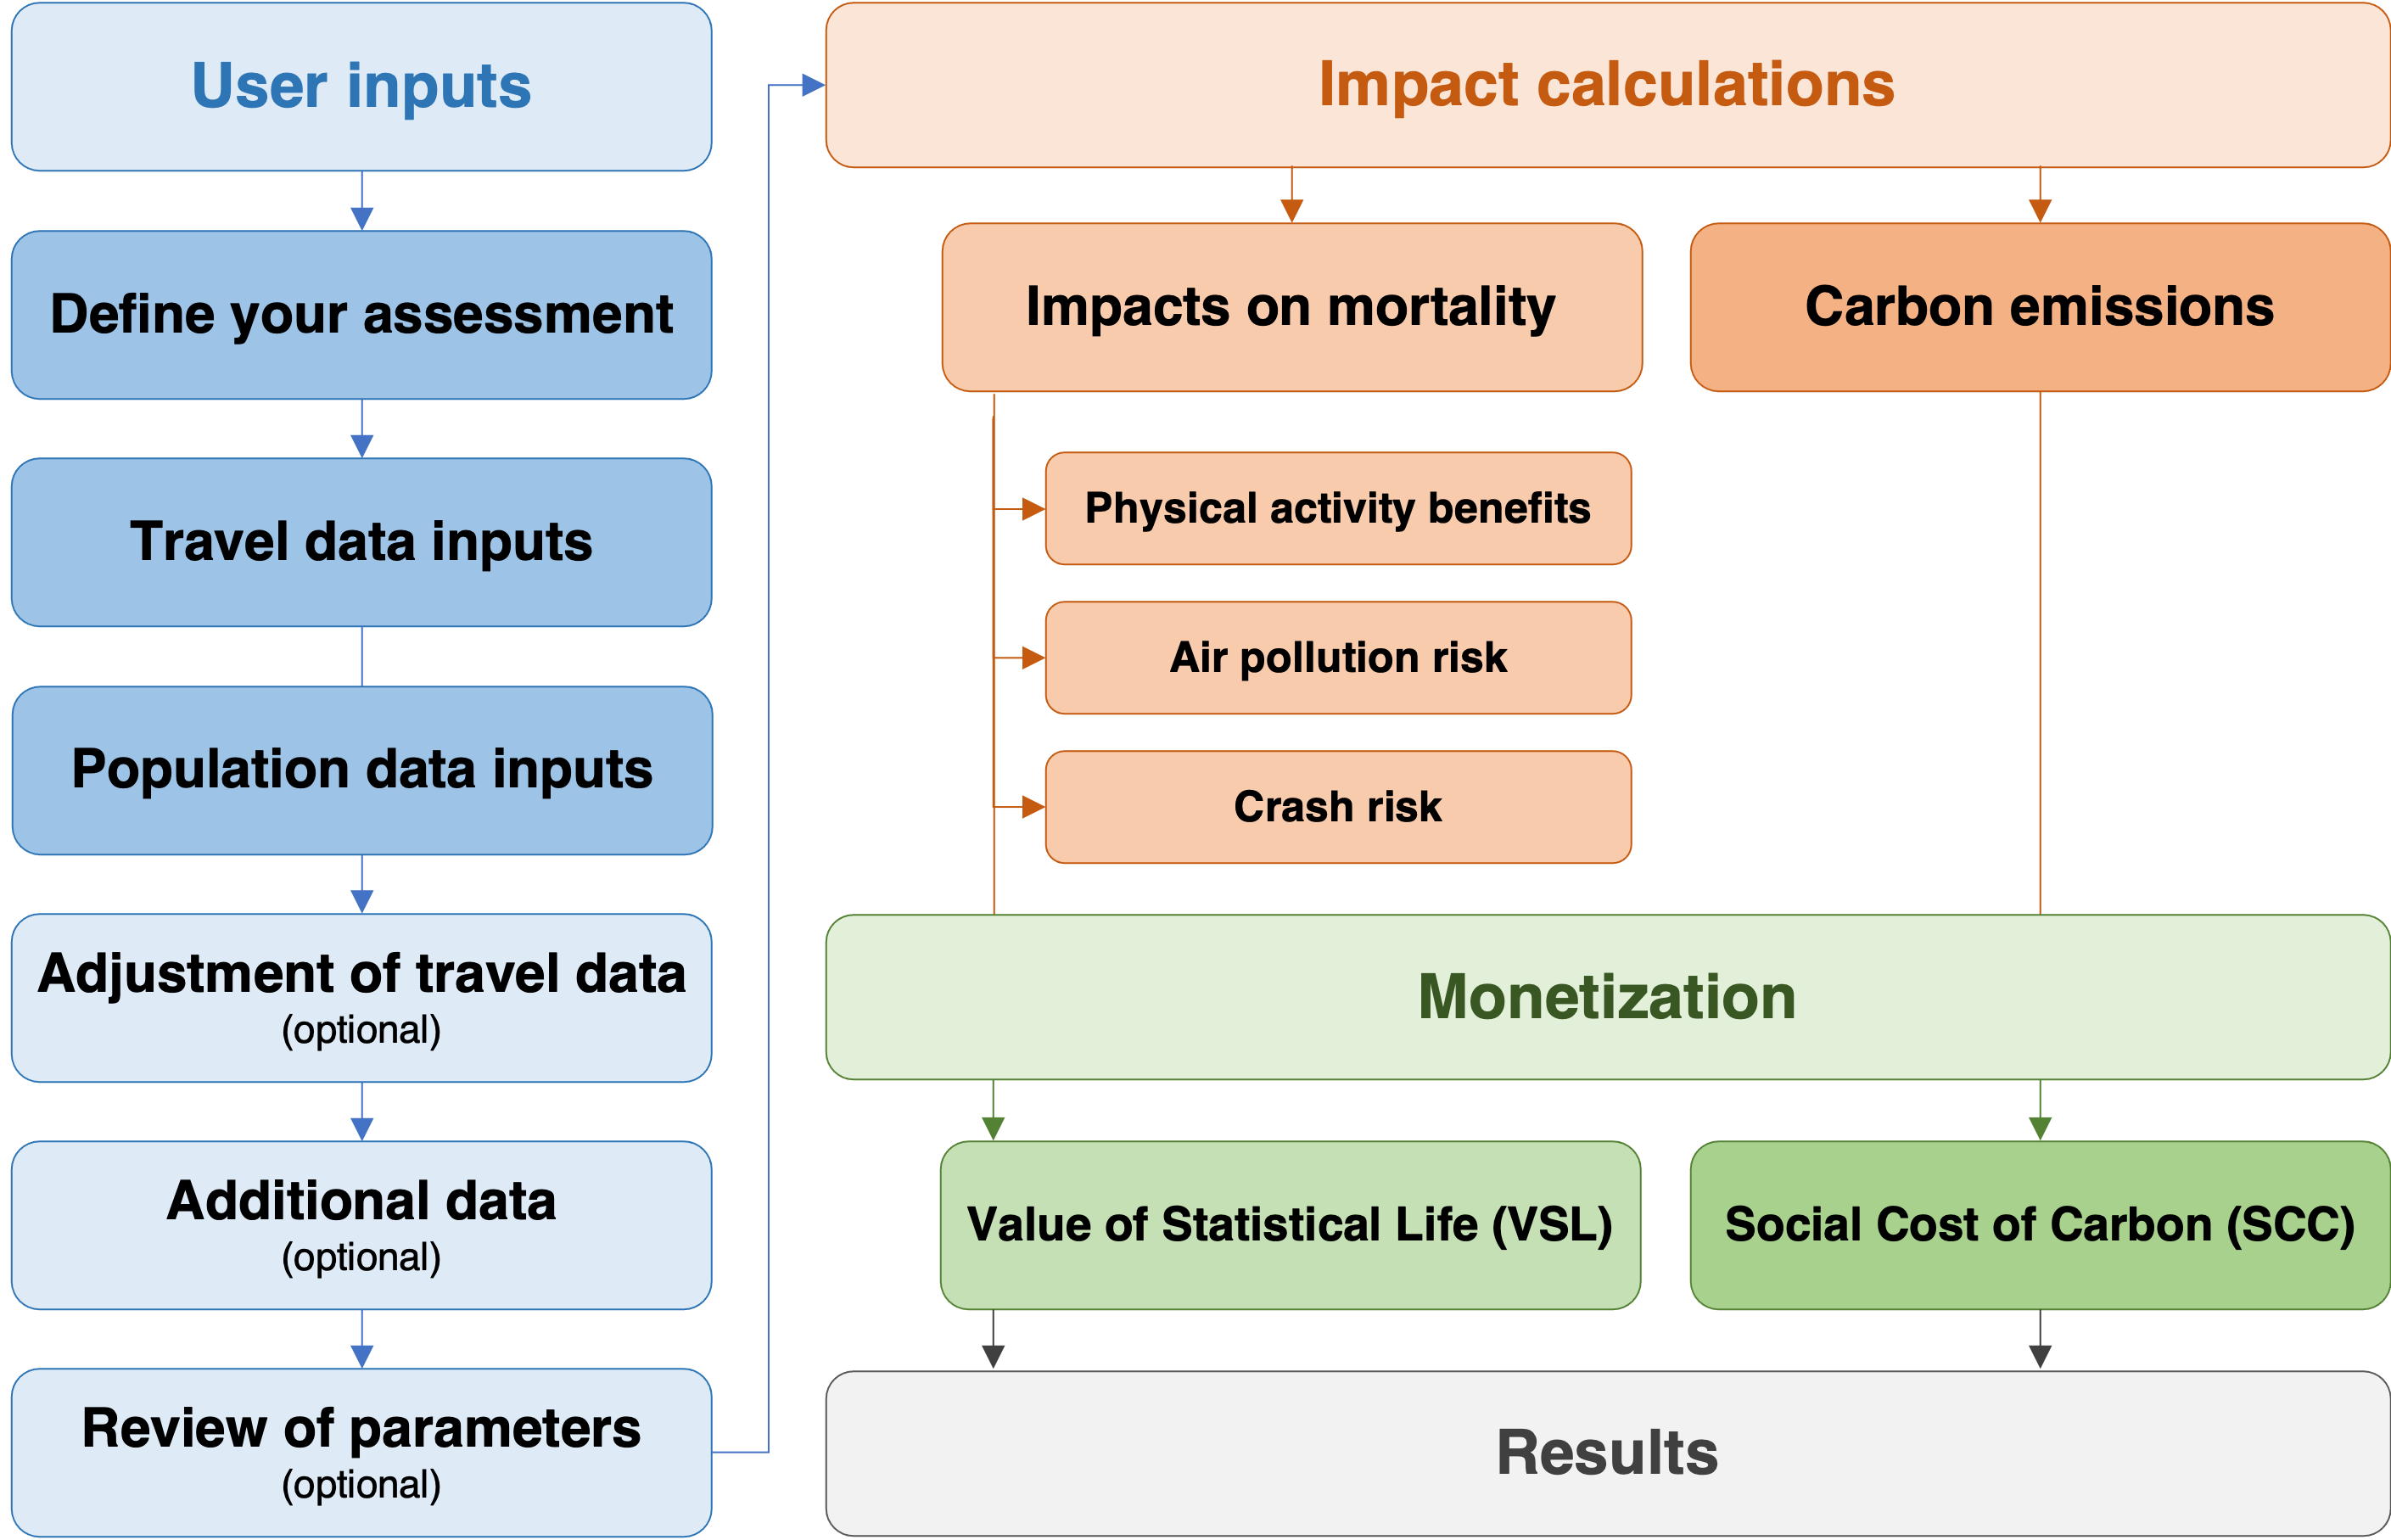
Steps of a HEAT assessment
- Step 1: Define your assessment
- Step 2: Enter travel and population data
- Step 3: Review data adjustments
- Step 4: Check calculation parameters
- Step 5: Review, test and save the results
Select a step below, then open its fold-out. Longer steps also have fold-outs for individual topics.
Before you start
- Write down the question, place, modes, population and time period you want to assess. Check whether HEAT is suitable for that population and purpose.
- Prepare travel amounts, units, population type/age range and population size for each case. Keep data sources and assumptions beside you.
- Choose a single case or define the reference and comparison cases consistently. Do not confuse survey sample size with the population represented.
- For a more detailed assessment, gather any relevant local mortality, pollution, crash-risk, economic and – in case you wish to derive a benefit-cost-ratio – investment-cost data.
Step 1: Define your assessment
Language selection
What to enter or check: Choose the language and the number/currency format that you want to use.
Why this is needed: This controls how questions and numerical values are displayed. Check decimal and thousands separators before entering data.
When this applies: All interfaces.
User interface options
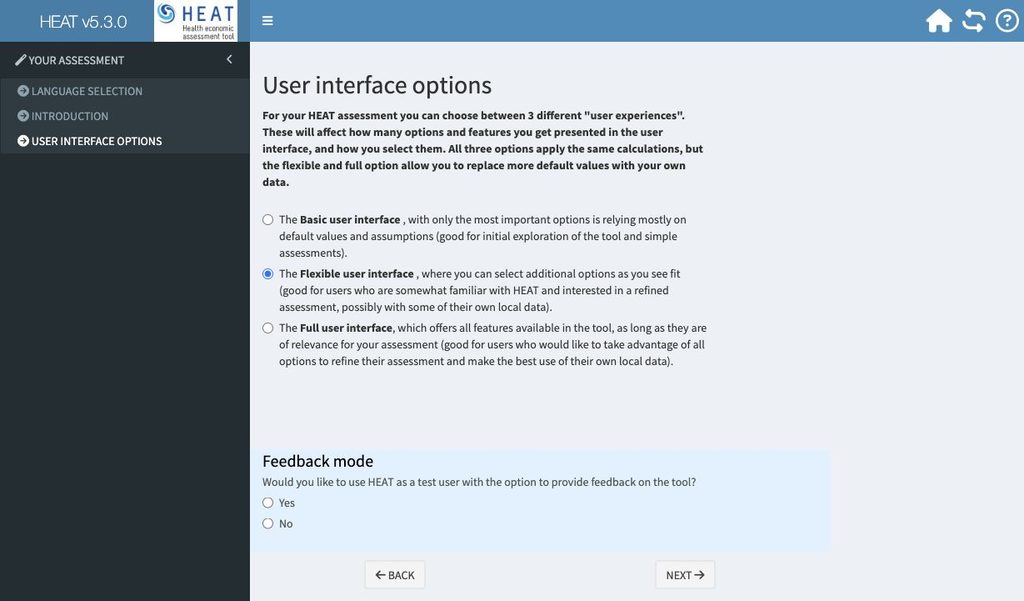
What to enter or check: select the user interface option according to your needs:
- Basic: enter the essential assessment, travel and population information (physical activity impacts only), review the supplied defaults, and inspect the results.
- Flexible: follow the same route and select extra impact pathways and adjustment options where they improve your assessment.
- Full: work through all relevant adjustment and parameter panels. This changes the available controls, not the underlying calculation method.
Why this is needed: All three interfaces use the same calculations. The choice controls how many questions you see and how many defaults you can replace.
When this applies: Basic uses mainly defaults; Flexible lets you choose extra adjustments; Full displays all relevant adjustments.
Active travel modes
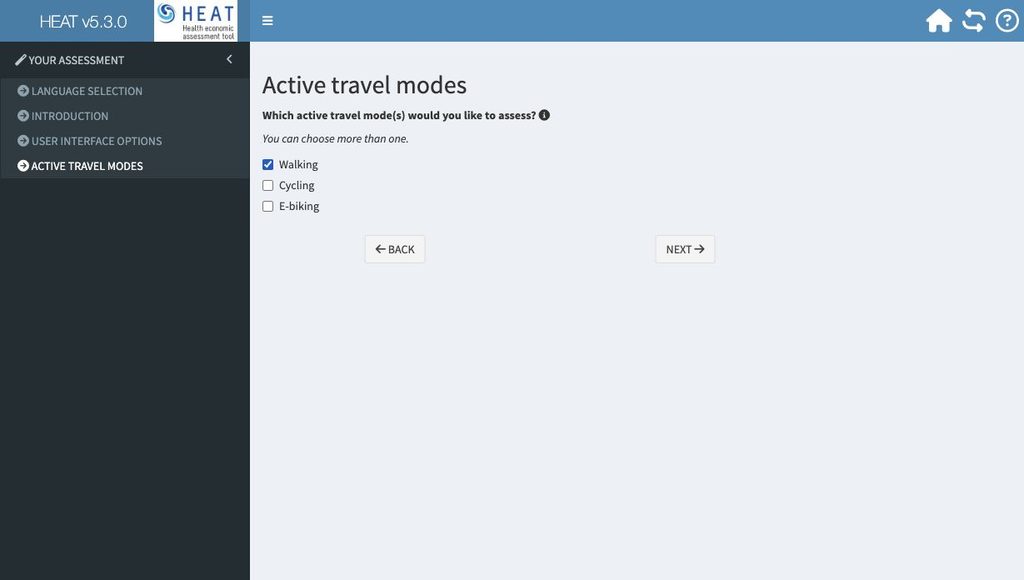
What to enter or check: Select walking, cycling, e-biking and/or bike sharing, according to the activity covered by your data. Bike-sharing assessments require data specific to the scheme.
Why this is needed: The selection determines the travel inputs and the assumptions used for each mode. Keep e-bike and conventional cycling data distinct when assessing them separately.
When this applies: All interfaces; repeat the relevant input panels for each selected mode.
Geographic scale
What to enter or check: Select the country and the geographic level available in the tool, then the relevant area or city where requested. Use the location of the population whose travel you are assessing.
Why this is needed: HEAT uses the location to suggest population and background values, such as mortality, air pollution and economic parameters. A local assessment may still use national defaults.
When this applies: All interfaces. Use suitable local values when defaults do not represent the assessment area.
Comparison and time scale
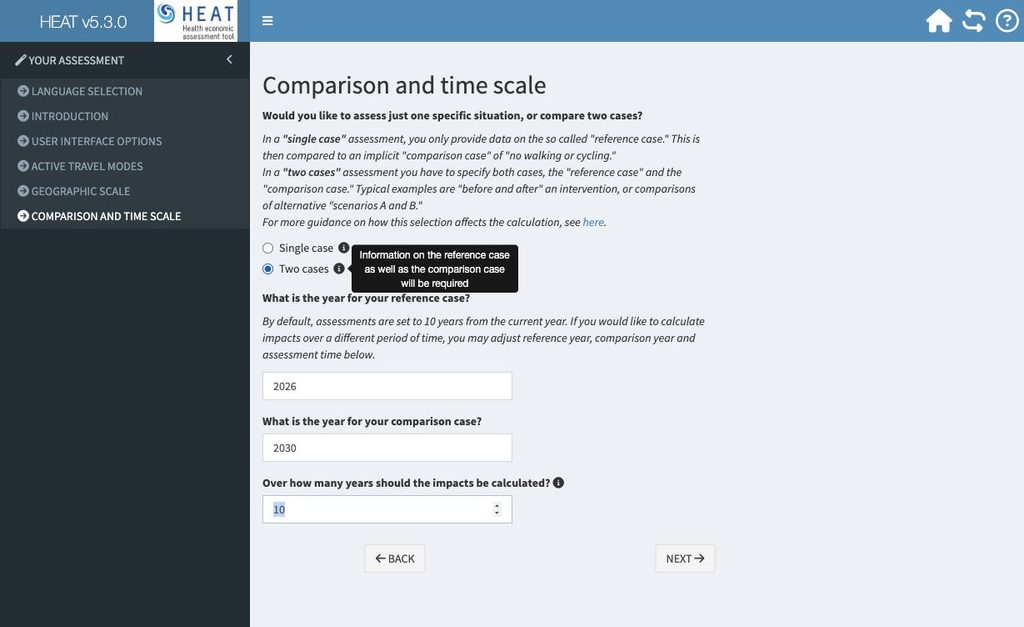
What to enter or check: Choose Single case if you have one situation to assess. Choose Two cases for a before/after comparison or two alternative scenarios. Enter the reference year, the comparison year when applicable, and the number of years over which impacts should be calculated.
Why this is needed: A single-case assessment compares your reference case with an implicit case of no walking or cycling. A two-case assessment requires data for both cases. The assessment period is separate from the dates defining those cases.
When this applies: All interfaces. HEAT initially suggests a ten-year assessment period; adjust it to your appraisal.
Impacts
What to enter or check: Select the effects you want included: physical activity, air pollution, crash risk and/or carbon emissions.
Why this is needed: Your selection determines which additional data and parameters are needed. The health pathways concern premature mortality; carbon emissions are reported separately and can also be valued economically.
When this applies: All interfaces. If crash-risk data are unavailable and cannot be estimated, remove that pathway rather than supplying an unsupported number.
Motorized modes and traffic conditions
What to enter or check: For a carbon assessment, choose No data, Basic categories, or Refined categories. If you have data, select the motorized modes covered. Choose the traffic conditions that best describe the assessment setting.
Why this is needed: HEAT needs to understand which motorized travel is replaced by active travel. Traffic conditions affect emissions. Without motorized-mode data, HEAT uses assumptions about modal shift.
When this applies: Carbon assessments only. To assess a reduction in active travel accompanied by more motorized travel, supply basic or refined motorized-mode data for both cases. “Basic categories” here describes transport categories, not the Basic user interface.
Step 2: Enter travel and population data
Data source, units and amount
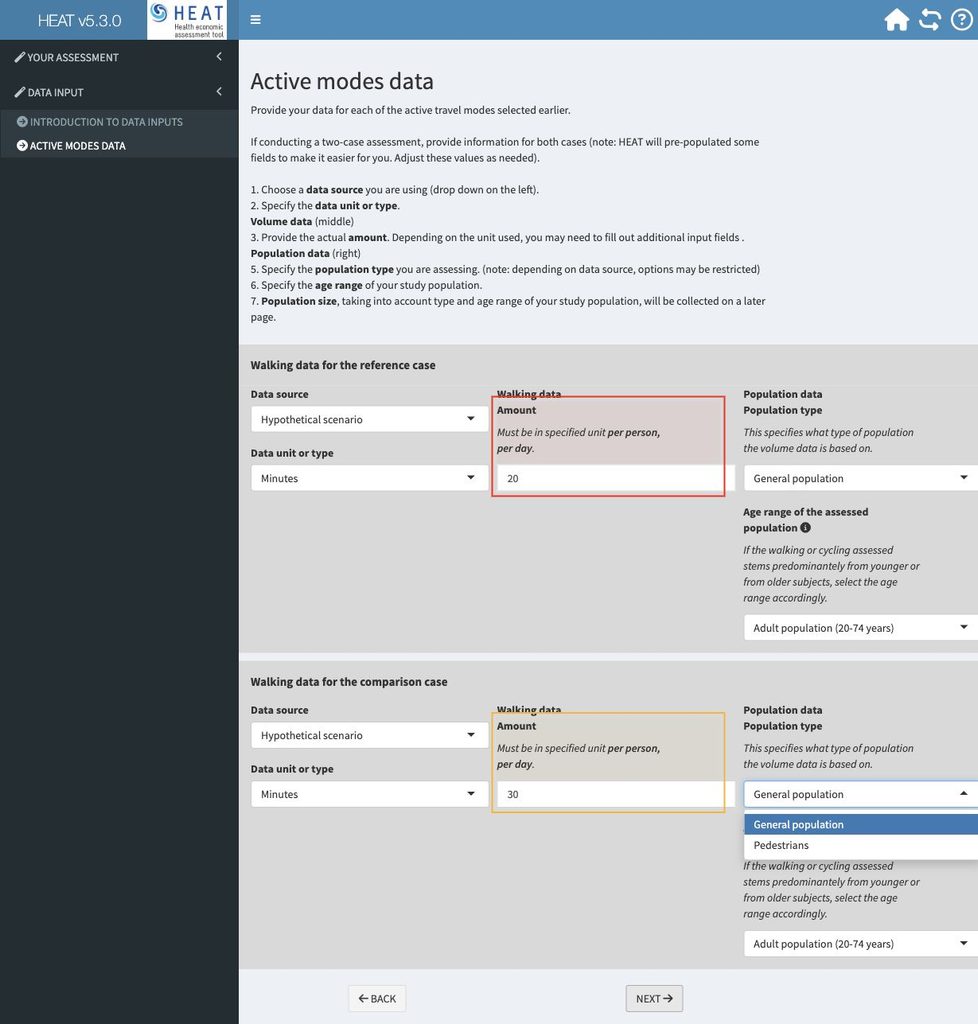
What to enter or check: For each mode and case, choose the data source/type and an available unit, then enter the amount in exactly the unit and time basis shown beside the field. Complete any additional fields requested for that unit.
Why this is needed: HEAT converts different input types to comparable daily amounts. A weekly total entered as a daily amount will overstate activity. Typical options include duration, distance, trips, counts, steps, modal share and frequency; percentage change is available for the comparison case where supported.
When this applies: All interfaces. For travel entered per person per day, average across the whole year and the population to which your data refer. For counts, follow the per-location and time-period instructions instead.
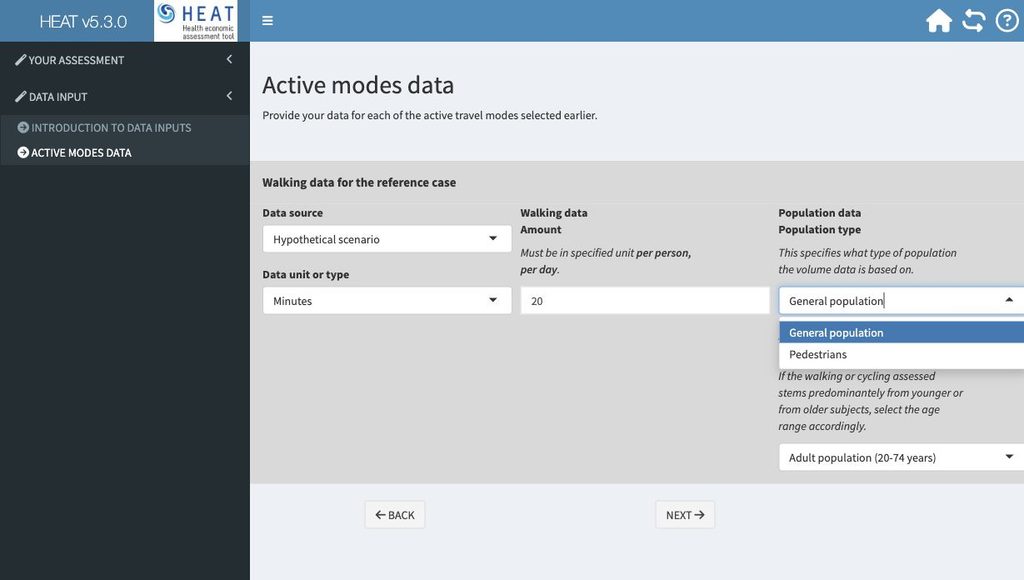
Population type and age range
What to enter or check: Specify whether the travel data describe the general population, including non-users, or only people who use the selected mode. Select the age range of the active travellers.
Why this is needed: The same amount per person means different things for a general population and for cyclists or pedestrians only. The age range determines which population and mortality parameters apply.
When this applies: All interfaces. The booklet’s main ranges are 20–74 years for walking, 20–64 for cycling, and 20–64 or 20–74 for e-biking. Use the appropriate younger/older subgroup where offered.
Population size
What to enter or check: Check the population suggested by HEAT, or enter the number of people represented by the travel data, within the selected age range, for each mode and case. If assessing a particular route or scheme, estimate its relevant users.
Why this is needed: The population scales the estimated impacts. Use the population represented by a survey, not the number of people interviewed. Make sure a users-only travel average is paired with a users-only population.
When this applies: All interfaces. HEAT may use total-area population and age-distribution data to suggest an age-specific figure. Review rather than assume that suggestion fits your study.
Motorized travel data
What to enter or check: If you chose to provide motorized-mode data, enter amounts for the selected categories and cases in the units requested. Use a consistent population, geographic scope and time basis across modes.
Why this is needed: These inputs help HEAT estimate how changes in walking or cycling relate to changes in motorized travel and carbon emissions.
When this applies: Carbon assessments with Basic categories or Refined categories selected. With No data selected, review the modal-shift assumptions in the adjustment step instead.
Step 3: Review data adjustments
Changes unrelated to the project
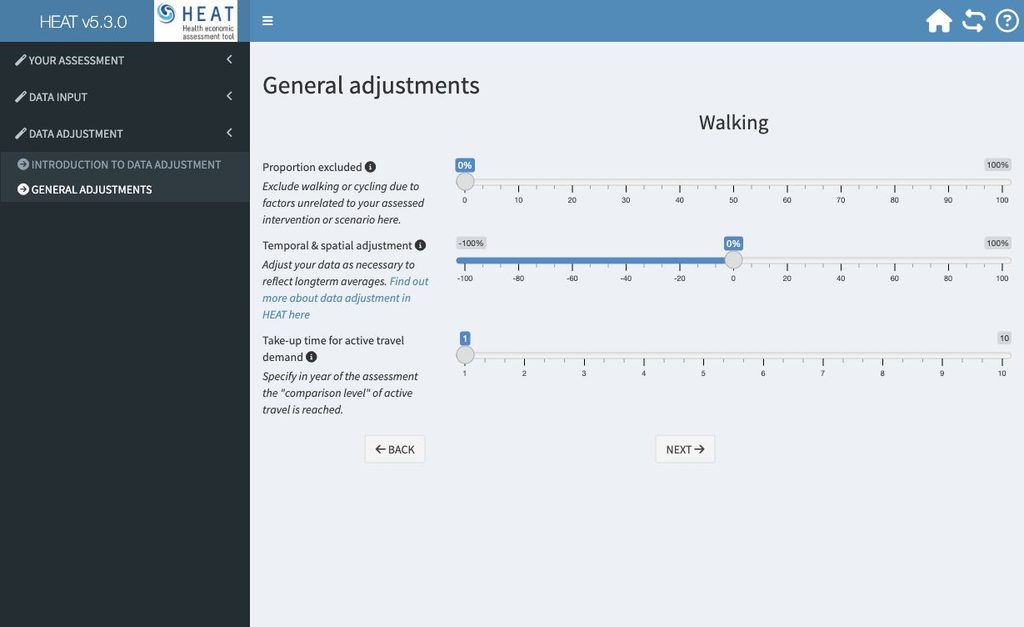
What to enter or check: Enter the proportion of walking or cycling that should be excluded because it is not attributable to the intervention you are assessing.
Why this is needed: A before/after difference can include wider trends as well as the project effect. This adjustment avoids attributing unrelated activity to the project.
When this applies: Two-case assessments, where offered. Basic generally relies on defaults; Flexible/Full expose additional adjustment controls.
Temporal and spatial adjustment
What to enter or check: Adjust the entered activity if the observations over- or under-represent typical conditions, for example because counts were taken in a particular season or at unrepresentative sites.
Why this is needed: A short count or local observation may not describe average long-term travel.
When this applies: Where offered. Follow the sign and percentage instructions in the tool; record how you derived the adjustment.
Uptake time for active travel demand
What to enter or check: Enter how many years it takes for the change in walking or cycling to reach its intended steady level.
Why this is needed: Use of a new facility or programme may grow gradually. Uptake time describes behaviour change; it is distinct from the time over which health benefits build up.
When this applies: Two-case assessments, where offered. The booklet gives one year as the initial uptake assumption.
New trips
What to enter or check: Specify the share of additional active trips that would not otherwise have been made.
Why this is needed: An entirely new trip does not replace a motorized trip, so it should not automatically receive the same avoided-emissions credit.
When this applies: Two-case carbon assessments, where offered.
Reassigned trips
What to enter or check: Specify the share of observed trips that were already being made but now follow a different route through the assessed infrastructure.
Why this is needed: A route diversion can increase counts on a facility without increasing total walking or cycling.
When this applies: Two-case assessments at sub-city level, where offered.
Travel for transport
What to enter or check: Enter the proportion of activity undertaken to reach destinations, rather than for recreation.
Why this is needed: For carbon calculations, recreational activity is assumed not to replace motorized trips. The distinction also informs air-pollution exposure.
When this applies: Air-pollution and carbon assessments, where offered.
Mode shift
What to enter or check: Review the shares of travel shifted from other transport modes and replace them with local estimates if available.
Why this is needed: Carbon effects depend on which modes are replaced, not just on the additional walking or cycling.
When this applies: Carbon assessments, where offered. Check the shares and any total shown by the tool.
Travel in traffic
What to enter or check: Enter the proportion of walking or cycling taking place in traffic, rather than away from major roads, for example in parks.
Why this is needed: Air-pollution exposure varies with the environment in which people travel.
When this applies: Air-pollution assessments, where offered.
Change in crash risk
What to enter or check: Enter the expected change in crash risk over time if you have evidence supporting a different risk level.
Why this is needed: Changes in infrastructure or traffic conditions may change risk independently of the amount travelled.
When this applies: Two-case crash assessments, where offered.
Substitution of physical activity
What to enter or check: Enter the proportion of the assessed activity that replaces other physical activity, such as previous leisure-time exercise.
Why this is needed: If walking or cycling replaces another form of exercise, the net gain in physical activity is smaller than the new travel alone.
When this applies: Physical-activity assessments, where offered.
Investment costs
What to enter or check: If you want a benefit–cost ratio, provide the relevant cost of the investment or programme, in the currency/unit requested by the tool. Include the costs needed to produce the assessed activity.
Why this is needed: The benefit–cost ratio compares the economic benefits with those costs. A narrow campaign cost paired with benefits that also depend on major infrastructure can give a misleading ratio.
When this applies: Where offered. Keep the cost scope consistent with the intervention and assessment period.
Step 4: Check calculation parameters
Mortality rate
What to enter or check: Review the annual all-cause mortality rate for the population and age range assessed. If you have an appropriate local crude death rate, use it in the requested units: deaths per 100,000 people per year.
Why this is needed: The mortality rate provides the baseline against which changes in premature mortality are estimated. An age-mismatched or incorrectly scaled rate can strongly affect results.
When this applies: For health assessments. Basic uses supplied values for many parameters; Flexible/Full allow more replacements. Complete missing required values when prompted.
Air-pollution concentration
What to enter or check: Review the ambient PM2.5 concentration in micrograms per cubic metre (µg/m³) and supply a suitable local estimate if no default is available.
Why this is needed: This is the background pollution input used to estimate the air-pollution pathway. It is separate from the proportion of travel in traffic.
When this applies: Air-pollution assessments. If only PM10 data are available, follow the tool/booklet conversion guidance rather than entering them as PM2.5.
Crash fatality rates
What to enter or check: Review the mode-specific fatality rates and, where shown, the road-fatality counts and annual distances used to calculate them. Replace values only with data covering a consistent place, period and travel mode.
Why this is needed: The rate relates fatalities to distance travelled. A fatality count alone is not a distance-based risk estimate.
When this applies: Crash assessments. If no default exists, provide a defensible rate or matching fatalities/exposure data. If neither is available, go back and deselect Crash risk.
Value of a statistical life and currency
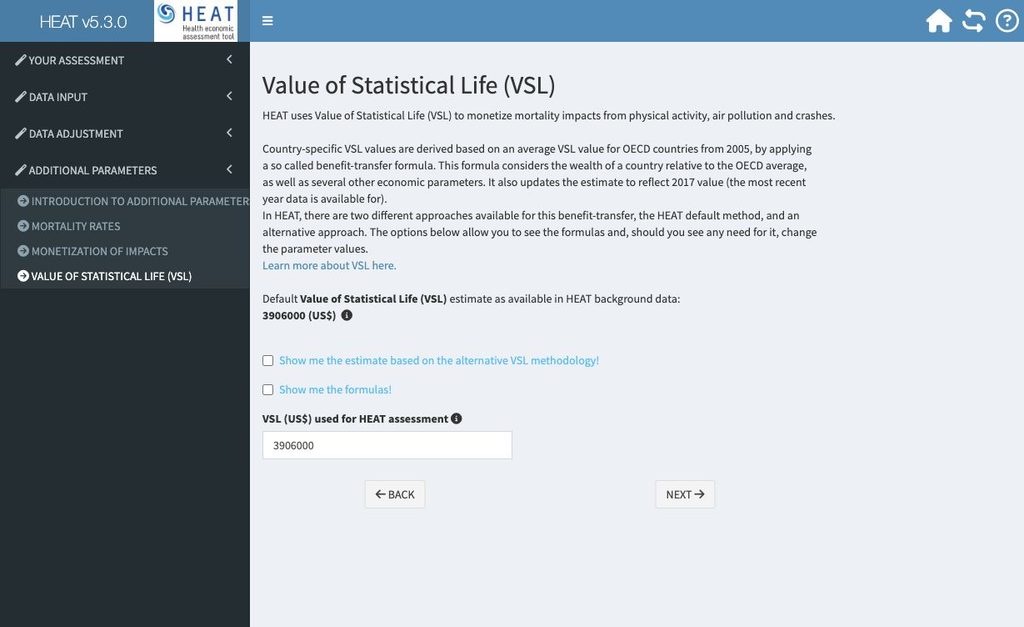
What to enter or check: Choose the currency basis shown in the tool and review the VSL. Retain the standard approach unless you have a reason to use the alternative method or an appraisal value required in your context.
Why this is needed: VSL converts changes in mortality risk into monetary values; it does not price an individual person’s life. Currency basis and valuation choices strongly affect economic results.
When this applies: The standard/default approach is available for simple assessments. Flexible/Full allow more detailed adjustments. Distinguish local currency, market-exchange-rate US dollars and purchasing-power-parity international dollars.
Carbon values
What to enter or check: Review the values used to monetize carbon emissions, and replace them with appropriate appraisal values where available and supported.
Why this is needed: The social cost of carbon determines the economic value of the estimated emissions change. Keep the value’s units, currency and year consistent with the tool.
When this applies: Carbon assessments. Additional parameter controls depend on the selected interface.
Discount rate
What to enter or check: Review the rate used to convert future economic benefits to present value. Use the rate required by your appraisal context where appropriate.
Why this is needed: Benefits occurring in later years are generally discounted. If HEAT outputs will be discounted within a wider appraisal, avoid applying the discount twice.
When this applies: The booklet gives 5% as the default. If discounting is applied only in the wider appraisal, use 0% within HEAT.
Calculation parameters overview
What to enter or check: Review the complete table of inputs, default values and background parameters. Change editable values only when you have suitable evidence; note the source, year and reason for each change.
Why this is needed: This is the final opportunity to detect inconsistent units, populations, assumptions or economic values before interpreting the outputs. Some background parameters are fixed.
When this applies: All interfaces have a review workflow; Flexible/Full provide more opportunities to replace defaults.
Step 5: Review, test and save the results
Results summary
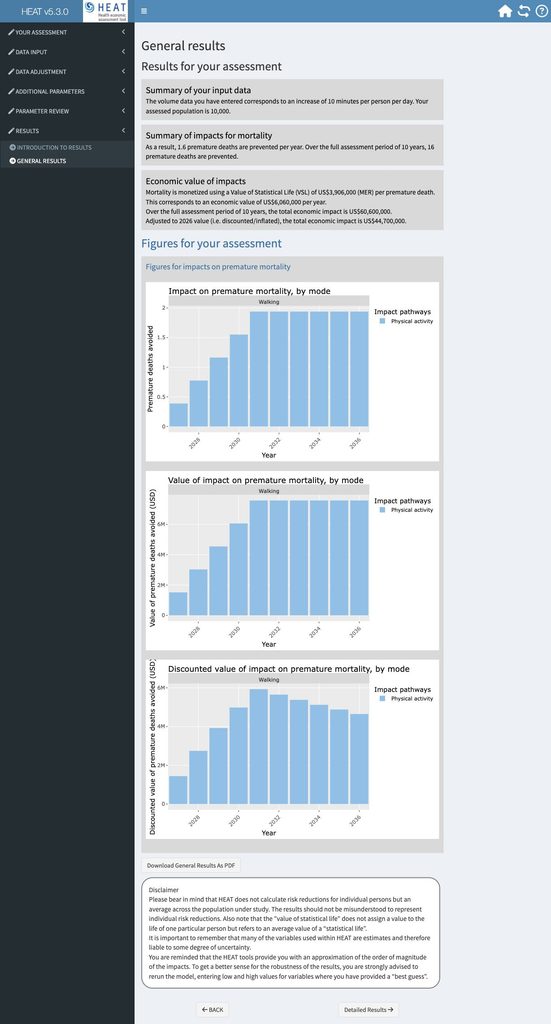
What to enter or check: First check the walking/cycling amounts and population shown. Then review premature deaths prevented, changes in carbon emissions and their economic values for the selected pathways.
Why this is needed: Outputs are only meaningful if the inputs describe the intended population and cases. Distinguish annual effects, totals over the assessment period and discounted monetary values.
When this applies: All interfaces. A two-case result describes the difference between cases, not the total benefit of every trip in both cases.
Detailed results
What to enter or check: Select the modes and impact pathways you want to examine in the detailed output. Check positive and negative contributions separately before using a combined total.
Why this is needed: A net result can hide offsetting physical-activity benefits, air-pollution/crash risks and carbon effects.
When this applies: All interfaces; only selected modes and pathways are reported.
Sensitivity analysis
What to enter or check: Rerun the assessment with plausible low and high values for uncertain inputs. Give particular attention to travel amounts, population, mortality rates, VSL and assumptions about behaviour change and modal shift.
Why this is needed: HEAT provides estimates based on evidence and assumptions. A range of scenarios shows how sensitive your conclusions are to uncertain inputs.
When this applies: All interfaces. Record exactly which inputs change between runs.
Save and export
What to enter or check: Use the result/export options offered by the tool to retain the results report and detailed input/output data. Keep a separate note of assumptions, data sources and scenario definitions.
Why this is needed: A reproducible assessment requires both the outputs and the inputs that produced them. The booklet describes PDF export of results and export of detailed data.
When this applies: All interfaces. Use the available export controls before ending the assessment.
Before you use the results
- Check units, age ranges and population type/size in every mode and case.
- Review which values are local data, defaults or assumptions.
- Record reference/comparison dates, uptake time, assessment duration and discount rate.
- Keep the input file, results report and sensitivity runs together.
Sources
Adapted from WHO Regional Office for Europe, HEAT Methods and User Guide, 2024 update, Chapter 4, sections 4.1–4.2.6, pp. 83–89.
Consult the HEAT methods and user guide for the full methodology and user instructions.