Using count data for HEAT assessments
A busy new trail does not necessarily mean people are walking or cycling more overall. Some may simply have changed route. This guide shows how to turn counts into a defensible estimate of additional active travel, then enter it in HEAT.
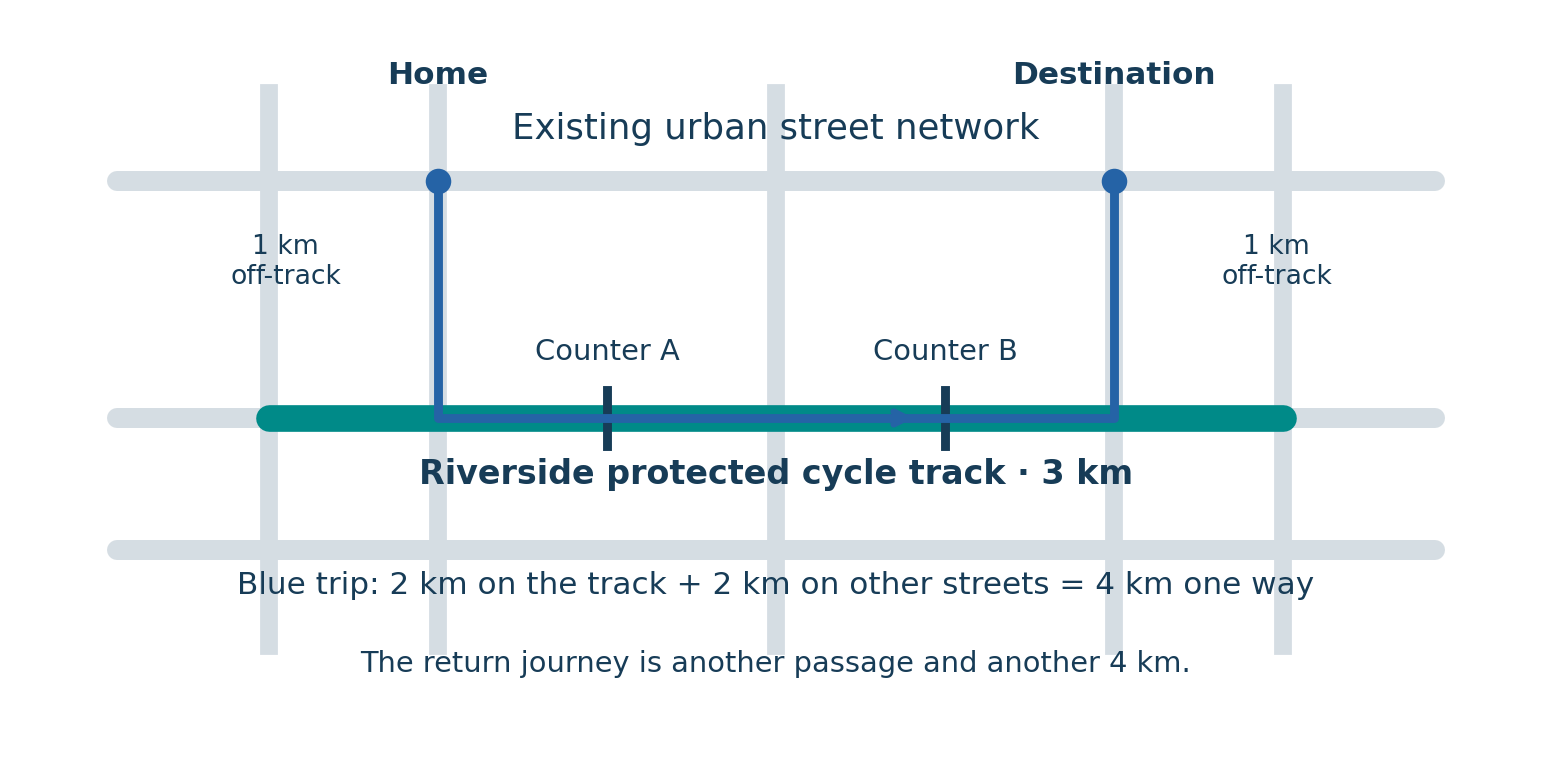
We follow one fictional example: a 3 km Riverside cycle track replacing a less comfortable route through an existing urban street network. The same principles apply to pedestrian trails. All numbers are illustrative, not recommended defaults.
1. Decide what you are comparing
Ask: How much extra walking or cycling occurred because of the facility? Count before and after at the same location, covering the same directions and types of users. A counter on a new track cannot be compared with zero simply because no counter or track existed before: people may already have cycled on nearby streets.
At counter A, our comparable 14-day campaigns record 400 passages per day before and 800 after. Both include full days and weekends. For simplicity, these example counts represent adults in the assessed cycling age range. Real counts may need an age-group estimate. Trips that never pass A are outside this counter’s coverage.
2. A passage is not a person—and needs a distance
Someone cycling past A to work and back generates two passages. A short user survey suggests an average 4 km one-way cycling trip per passage, including streets beyond the track. Two such passages represent 8 km travelled, not one person travelling 4 km.
Use a distance that matches what the counter records. Do not multiply two passages by a whole round-trip distance, or automatically remove the return passage as a duplicate. The track’s 3 km length is not automatically the distance of every user’s trip.
What changes if there are several counters?
A and B can record the same one-way trip. Suppose A records 600 passages per day and B records 400. A route survey establishes that all 400 trips at B also pass A: the combined set contains 600 distinct one-way trips, not 1,000. Counting the return journey separately is still correct.
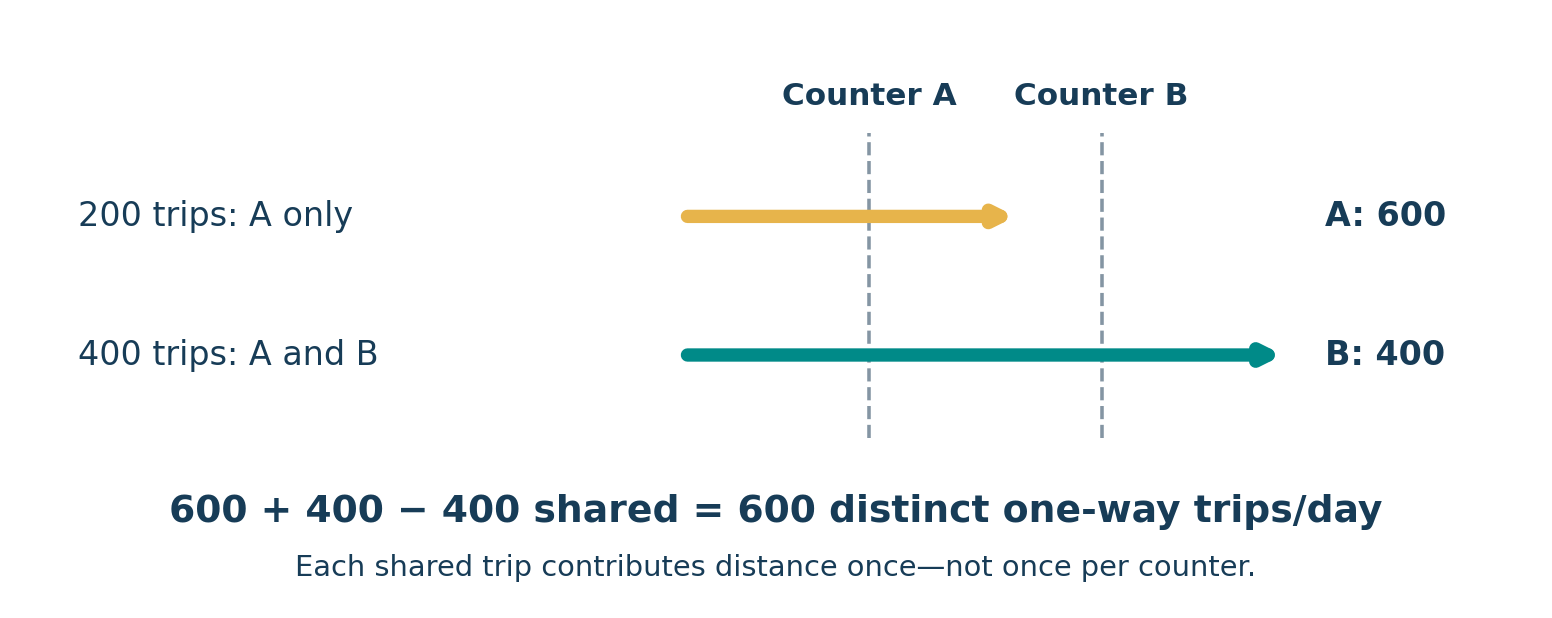
Use route questions in a survey, suitable trip data or a counting layout that identifies overlap. With more counters, each one-way trip still belongs in the combined set once. Spacing alone does not reveal overlap. Match the average trip distance to this combined trip set; do not simply sum or average counter readings and call that a corridor total.
HEAT does not identify this overlap for you. If you have prepared a corridor-wide total in kilometres per day, you can instead use a distance input: divide that total by the relevant population to obtain kilometres per person per day. State any gaps in counter coverage.
3. Turn short counts into a typical year’s daily average
Sunny summer counts can overestimate year-round activity; wet or cold counts can underestimate it. Allow for time of day, weekdays/weekends and season. Ideally, use a nearby continuous counter with similar travel patterns, unaffected by the project. A leisure trail may have a different pattern from a commuter route.
Our comparison counter averages 750 passages per day across the year, but 1,000 during the count campaigns. The correction is 750 ÷ 1,000 = 0.75: reduce the short counts by 25%. Here the same factor happens to fit both campaigns; in practice, estimate each separately.
| Counter A | Before | After |
|---|---|---|
| Observed daily average | 400 | 800 |
| Annual-average daily estimate (× 0.75) | 300 | 600 |
HEAT’s Temporal & spatial adjustment slider accepts percentage corrections: −25% multiplies the entered travel by 0.75; +25% multiplies it by 1.25. In the walkthrough below, we enter the already corrected 300 and 600, so leave this slider at 0%. Correct the same data only once.
If the two count campaigns need different corrections
Annualize the before and after figures separately in a worksheet, then enter them with 0% temporal adjustment. The current tool has one adjustment setting per mode, shared across both cases. A shared −25% would also work for our raw 400 and 800, but not where the two cases need different factors.
4. Separate additional travel from a change of route
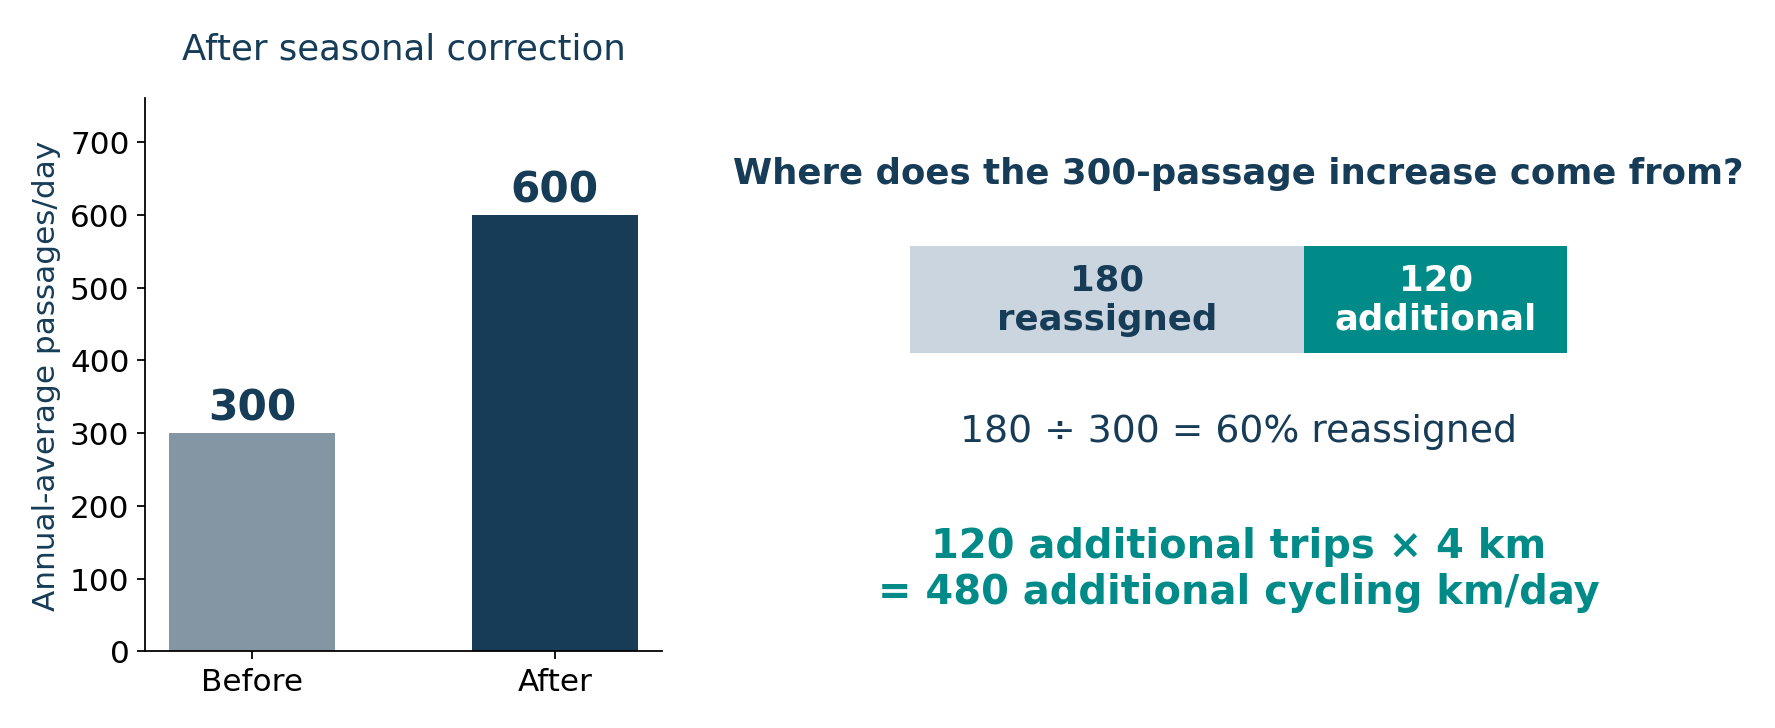
The corrected increase at A is 600 − 300 = 300 passages per day. Our fictional route survey and nearby-street counts suggest that 180 are existing cycling trips now using the track. These are reassigned trips: they raise track counts without increasing total cycling, if trip distance stays the same.
That leaves 120 additional one-way cycling trips per day, assuming no other underlying change. At 4 km each, this is 480 additional cycling km per day—about 0.18 million km per year. We assume the same average distance in both cases and for the trip groups in this example.
Also check what would have happened without the project. An unaffected comparison route or wider-area trend can help distinguish a project effect from unrelated growth. Season correction alone does not establish causation. Where evidence is weak, present a scenario with explicit assumptions and try lower and higher estimates.
Reassigned, shifted and newly induced trips are different
Reassigned: the same cycling trip takes another route. Shifted: a previous car or public-transport journey is now cycled. Newly induced: a journey is made that did not previously take place. Shifted and newly induced trips can both add cycling; HEAT’s “new trips” setting does not mean all additional cycling.
Rerouting can still improve safety or reduce pollution exposure, and a different route can change distance travelled. Those effects need separate evidence; do not credit the whole existing trip as additional activity. If adding carbon or other pathways, review their mode-shift and exposure assumptions too: counts alone do not supply them.
5. Estimate the people represented
The 600 daily passages might represent roughly 300 people if each passes twice that day. They do not identify distinct users over a week or year. Occasional visitors and different travel frequencies matter. Use a short user survey, local knowledge or a documented catchment estimate; do not use the number of survey respondents as the population.
Suppose our survey suggests an affected group of 600 adult users. We use that group in both cases, including people who cycled less or not at all before. For count inputs, the travel total is already set by passages and distance. Within HEAT’s usual linear range, a different plausible population estimate generally leaves the total physical-activity benefit practically unchanged. An implausibly small population can reach the risk-reduction cap. Age and mortality assumptions still matter.
Describe the result as activity associated with an estimated user group, rather than claiming that the counter measured 600 distinct people. With a non-linear dose–response model, spreading the same activity across fewer or more people could change the estimated benefit.
6. Enter the worked example in HEAT
Choose the Full user interface, Cycling, your city and Yes to the sub-city/facility question, then Two cases. For this first walkthrough select Physical activity. Enter the real reference/comparison years and assessment period for your project.
| Entry | Reference: before | Comparison: after |
|---|---|---|
| Data source | Count data | Count data |
| Data unit or type | Short term counts | Short term counts |
| Average daily travelers | 300 | 600 |
| Distance travelled ‘per count’ (km) | 4 | 4 |
| Population type / age range | Cyclists / relevant adult range | Same |
| Population size (illustrative) | 600 | 600 |
Under Data adjustment, leave Temporal & spatial adjustment at 0% because the counts are already annualized. Set Proportion of reassigned trips to 60%: 180 of the 300-passage increase is rerouting. This shared setting scales both cases, leaving 40% of their difference: 120 trip-equivalents × 4 km = 480 additional km per day. Keep the original 300/600 figures in your reporting; the adjusted appraisal quantities are not new observations.
Do not use 30% (180 ÷ 600) for that shared-slider recipe, and do not subtract reassigned trips in your worksheet and exclude them again in HEAT. If you have already removed them, leave reassignment at 0%. Review the other adjustment and calculation settings, then check the travel amounts and assumptions before interpreting the health results.
When a facility-only perspective is more appropriate
You may instead need an assessment restricted to travel on the facility—for example, to describe activity within a defined route boundary, or where reliable off-facility distances are unavailable. Estimate the average distance actually travelled on the facility per passage, not automatically its full length.
If the same trips use an average of 2 km on Riverside, replace 4 km per count with 2 km in both cases: 120 additional trips × 2 km = 240 additional on-facility km per day. Label this a facility-only estimate. It does not include additional travel on connecting streets. Keep the same boundary before and after, and avoid adding it to a whole-trip estimate that already includes those kilometres.
Before using the result
- Keep the count locations, directions, dates and coverage; check counter errors and age eligibility.
- Record the distance-per-count source and whether it covers whole trips or only the facility.
- Document seasonal corrections, shared trips between counters, rerouting and unrelated trends—each once.
- Show a plausible low/high scenario for uncertain trip distances and the share of genuinely additional activity.
For the adjustment controls, see Adjusting input data. For the wider workflow, see the HEAT step-by-step guide.
Sources and further reading
- HEAT: Minimum user input data and Population data.
- HEAT calculator, version 5.3.0: count inputs and adjustment controls checked 20 November 2026.
- FHWA, Traffic Monitoring Guide, Chapter 4: non-motorized traffic—count coverage and adjustments using continuous count patterns.
- FHWA, Traffic Monitoring Guide (2022): traffic monitoring programs—why selected count sites may not represent a wider area.